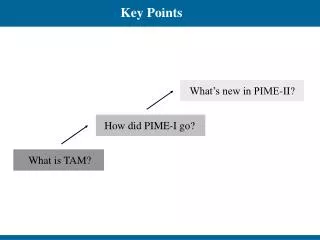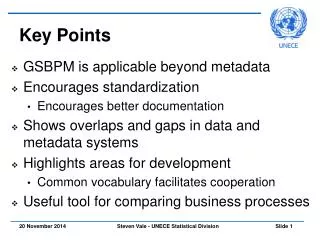
Key Points
Why is HIV Prevalence So Severe in Southern Africa?, and “ What Works” (and Doesn’t) for AIDS Prevention ? Daniel Halperin , PhD, MS Senior Advisor for Behavior Change/Primary Prevention, USAID With assistance from colleagues at USAID, World Bank, Global Fund, UCSF, etc. Key Points.


Key Points
E N D
Presentation Transcript
Why is HIV Prevalence SoSevere in Southern Africa?, and“What Works” (and Doesn’t)for AIDS Prevention?Daniel Halperin, PhD, MS Senior Advisor for Behavior Change/Primary Prevention, USAIDWith assistance from colleagues at USAID, World Bank, Global Fund, UCSF, etc.
Key Points * Back to the Basics: using a “basic public health” approach to prevention • Using evidence (vs. politics, ideology, etc.) to set priorities • *Prevention works (Uganda today compared to 10-15 yrs. ago) [Please see the “notes” under most of the slides!]
HIV PREVALENCE BY REGION 35 30 Southern Africa 25 20 % HIV prevalence 15 Eastern Africa 10 Central Africa 5 West Africa 0 1990 1991 1992 1993 1994 1995 1996 1997 1998 1999 2000 2001 2002 Source: Adapted from WHO AFRO 2003 Report 2004 Report on the Global AIDS Epidemic (Fig 8)
TRANSMISSION DYNAMICS • Epidemic concentrated - if transmission occurs largely among vulnerable groups and vulnerable group interventions would reduce overall infection • Epidemic generalized - if transmission occurs primarily outside vulnerable groups and would continue despite effective vulnerable group interventions • Epidemics DON’T inevitably keep escalating
HIV TRANSMISSION PATTERNSIN ACCRA, GHANA, 2003 Sources: GAC/NAP and Cote et al data, 2004
HIV TRANSMISSION PATTERNS IN MASHONALAND CENTRAL, ZIMBABWE Sources: Wilson and Cowan et al data, 2003
Economic Status and HIV prevalence (Tanzania) Source: 2003-2004 AIS
Education Status and HIV prevalence in Tanzania Source: 2003-2004 AISS
Why is HIV so much Higher in Southern Africa?? • Multiple concurrent partnerships (“nyatsi,” “lishende,” “small house,” “second office”...) • Lack of male circumcision • And various other factors, such as relatively developed/highly mobile societies, income inequality, gender dynamics, "dry sex,” etc.
“Concurrent” Partnerships *Source M. Carael, 1995; Halperin and Epstein, 2004
“Concurrent” Partnerships *Source M. Carael, 1995; Halperin and Epstein, 2004
Proportion of 15-24 year-olds reporting more than one current sexual partner, South Africa 2005 Source: South African National HIV Prevalence, HIV Incidence, Behavior and Communication Survey, 2005
“Map” of the largest component of a sexual network in Likoma, Malawi Source: Kohler H and Helleringer S. The Structure of Sexual Networks and the Spread of HIV in Sub-Saharan Africa: Evidence from Likoma Island (Malawi). PARC Working Paper Series: WPS 06-02
Mean: 1.74 Number of Partners Mean: 1.68 Mean: 1.80 Mean: 1.86 Largest components In largest component: 2% 10% 41% 64% Low degree networks create a transmission core Bicomponents in red A NATION AT WAR WITH HIV&AIDS Source: Martina Morris, Univ. of Washington, used with permission from a presentation given at a meeting on concurrent sexual partnerships and sexually transmitted infections at Princeton University, 6 May 2006.
Transmission efficiency “Mathematical models estimate the average probability of male–female transmission of HIV-1 per unprotected coital act to be between 0.0005 and 0.003% during chronic HIV infection, which in itself would not sustain an epidemic.”-Pao et al, AIDS (2005)
BEHAVIOURAL AND HIV TRENDS IN UGANDA Source: WHO/GPA surveys
CONCLUSION • MCP is a driver • Behavior can be changed • Challenge – HOW • Social Movement