Key Points
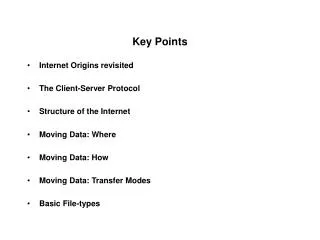
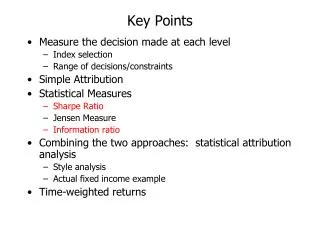
Key Points. Measure the decision made at each level Index selection Range of decisions/constraints Simple Attribution Statistical Measures Sharpe Ratio Jensen Measure Information ratio Combining the two approaches: statistical attribution analysis Style analysis

Key Points
E N D
Presentation Transcript
Key Points • Measure the decision made at each level • Index selection • Range of decisions/constraints • Simple Attribution • Statistical Measures • Sharpe Ratio • Jensen Measure • Information ratio • Combining the two approaches: statistical attribution analysis • Style analysis • Actual fixed income example • Time-weighted returns
Long-Term Returns Expectations Benefit Requirements/ Risk Constraints Risk Tolerance Constraints Set Objectives Set Policies Construct Portfolios AssetClass Allocation Risk Targets Income Generation Security Selection Diversification Tax Position A Professional Investment Process
Where Are The Decisions Made? • Objectives • Board Level • Policies appropriate? • Board • Consultant • Staff • Asset Allocation • Board • Consultant • Staff • Portfolios effective? • Investment manager • (Consultant and staff)
Factors That Lead to Abnormal Performance • Market timing • Superior selection • Sectors or industries • Individual companies
Portfolio Return Compare To Bogey Asset Allocation Contribution Overall Selection Contribution Equity Sectors Individual Stock Selection Fixed Income Sectors Individual Bond Selection
rp – rf σp Sharpe Ratio • A measure of the payoff for totalrisk taken
Treynor’s Measure • Excess Return/B (rp-rf)/Bp
Jensen Measure • A risk-adjusted alpha Alphap = rp - (rf + Bpx (rM-rf)
(rp – rbogey ) σ(rP –rbogey) D Σ σD Information Ratio A measure of excess return gained by deviating from the the bogey / index Basically defines the bogey or index as “the market”
Risk-Adjusted Performance • A general approach used extensively • Risk-adjusting not limited to “market” base • Adjusts UP returns for a low risk portfolio (remember, this is ex post) • Adjusts DOWN returns for a high risk portfolio RAPp = rf + (σmkt/σp) x (rp-rf)
Dollar- and Time-Weighted Returns Dollar-weighted returns • Internal rate of return considering the cash flow from or to investment • Returns are weighted by the amount invested in each stock Time-weighted returns • Not weighted by investment amount • Equal weighting