Download
1 / 31
320 likes | 506 Vues
Modeling and Predicting Climate Change. Michael Wehner Scientific Computing Group Computational Research Division mfwehner@lbl.gov. Global Warming: Do you believe?. Intergovernmental Panel on Climate Change 2001

E N D
Modeling and Predicting Climate Change Michael Wehner Scientific Computing Group Computational Research Division mfwehner@lbl.gov
Global Warming: Do you believe? • Intergovernmental Panel on Climate Change 2001 • “An increasing body of observations gives a collective picture of a warming world and other changes in the climate system” • “There is new and stronger evidence that most of the warming observed over the last 50 years is attributable to human activities”
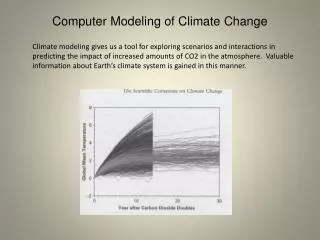
The data • Fact: Global mean surface air temperature is increasing. • Is this warming due to human factors? • Can we quantify natural variability? Signal to noise. • Do we understand the causes of this warming? • What does the future portend? • What will happen where I live? • Modeling helps us address these questions.
Computational demands • Historically, climate models have been limited by computer speed. • 1990 AMIP1: Many modeling groups required a calendar year to complete a 10 year integration of a stand alone atmospheric general circulation model. Typical grid resolution was T21 (64X32x10) • 2004 CCSM3: A fully coupled atmosphere-ocean-sea ice model achieves 5 simulated years per actual day. • Typical global change simulation is 1 or 2 centuries. • Control simulations are 10 centuries. • Atmosphere is T85 (256X128x26) • Ocean is ~1o (384X320x40)
Current resolution is not enough • Atmosphere • Regional climate change prediction will require horizontal grid resolution of 10km (3600X1800) • Cloud physics parameterizations could exploit 100 vertical layers • Ocean • Mesoscale (~50km) eddies are thought to be crucial to ocean heat transport • 0.1o grid will resolve these eddies (3600X1800) • Short stand-alone integrations are underway now. • Ensembles of integrations are required to address issues of internal (chaotic) variability. • Current practice is to make 4 realizations. 10 is better.
Simulated precipitation as a function of resolution Duffy, et al 300km 75 km 50 km
What is in a climate model? • Atmospheric general circulation model • Dynamics • Sub-grid scale parameterized physics processes • Turbulence, solar/infrared radiation transport, clouds. • Oceanic general circulation model • Dynamics (mostly) • Sea ice model • Viscous elastic plastic dynamics • Thermodynamics • Land Model • Energy and moisture budgets • Biology • Chemistry • Tracer advection, possibly stiff rate equations.
Technology limits us now. • Models of atmospheric and ocean dynamics are subject to time step stability restrictions determined by the horizontal grid resolution. • Adds further computational demands as resolution increases • Century scale integrations will require of order 500Tflops (sustained). • Current production speed is of order tens of Gflops in the US.
Q.Why are climate models so computationally intensive? • A. Lots of stuff to calculate! • This is why successful climate modeling efforts are collaborations among a diverse set of scientists. • Big science. • But this computational burden has other causes. • Fundamental cause is that interesting climate change simulations are century scale. Time steps are limited by stability criterion to minute scale. • A lot of minutes in a century.
An example of a source of computational burden • Task: Simulate the dynamics of the atmosphere • The earth is a sphere (well, almost). • Discretize the planet. • Apply the equations of motion • Two dimensional Navier-Stokes equations + parameterization to represent subgrid scale phenomena
Spherical Coordinates (q,f) • Latitude-Longitude grid. • Uniform in q,f • Non-uniform cell size. • Convergent near the poles • Singular • Simple discretization of the equations of motion. • Finite difference. • Finite volume.
Spherical Coordinates (q,f) • Two issues. • Courant stability criterion on time step • Dt < Dx/v • Dx = grid spacing, v = maximum wind speed • Convergence of meridians causes the time step to be overly restrictive. • Accurate simulation of fluids through a singular point is difficult. • Cross-polar flows will have an imprint of the mesh.
Spherical Coordinates (q,f) • Solutions to time step restrictions. • Recognize that the high resolution in the polar regions is false. • Violate the polar Courant condition and damp out computational instabilities by filters. • Works great, but… • Maps poorly onto distributed memory parallel computers due to non-local communication. • F` = SaijFi • Commonly used, most notably by UK Met Office (Exeter) and the Geophysical Fluid Dynamics Laboratory (Princeton)
Spectral Transform Method • The most common solution to the “polar problem” • Map the equations of motions onto spherical harmonics. • M = highest Fourier wavenumber • N(m) = highest associated Legendre polynomial, P • Resolution is expressed by the truncation of the two series. I.e. • T42 means triangular truncation with 42 wavenumbers • R15 means rhomboidal truncation with 15 wavenumbers.
Spectral Transform Method • Replace difference equations with Fourier and Legendre transforms. • Advantages • No singular points. • Uniform time step stability criteria in spectral space. • Very accurate for two-dimensional flow • Fast Fourier Transforms (FFT) • scales as mlog(m) rather than m2 • Very fast if m is a power of 2 • Very fast vector routines supplied by vendors.
Spectral Transform Method • Disadvantages • No parallel FFT algorithms for m in the range of interest. • mlog(m) is still superlinear. Scaling with higher resolution is poor. • Works poorly near regions of steep topography like the Andes or Greenland. • Gibb’s phenomena causes ‘spectral rain’ and other nonphysical phenomena
Spectral Transform Method • Use of FFT limits parallel implementation strategies • NCAR uses a one dimensional domain decomposition. • Restricts number of useful processors. • ECMWF uses three separate decompositions. • One each for Fourier transforms, Legendre transforms and local physics. • Requires frequent global redecompositions of every prognostic variable. • No further communication required within each step. • Hence, code is simpler as communications are isolated. • Operational NCAR resolution is T85 • LLNL collaborators have run up to T389 • ECMWF performs operational weather prediction at T1000+
Alternative formulations • An icosahedral mesh approximation to a sphere n=1 n=2 n=4 • No polar singularities • But 6 points in each hemisphere have a different connectivity
Icosahedral mesh • Spatially uniform • Ideal for finite differences • Would also be ideal for advanced finite volume schemes. • Easily decomposed into two dimensional subdomains for parallel computers. • Connectivity is complicated. Not logically rectangular. • Used in the Colorado State University climate model and by Deutsche Wetterdienst, a weather prediction service. • Old habits die hard…
A final creative mesh • In ocean circulation modeling, the continental land masses must be accounted for. • If the poles were covered by land, no active singular points in a rectangular mesh. • A clever orthogonal transformation of spherical coordinates can put the North Pole over Canada or Siberia. • Careful construction of the transformation can result in a remarkably uniform mesh. • Used today in the Los Alamos ocean model, POP.
A general modeling lesson from this example. • Modeling is always a set of compromises. • It is not exact. Remember this when interpreting results! • Many different factors must be taken into account in the construction of a model. • Fundamental equations are dictated by the physics of the problem. • Algorithms should be developed with consideration of several factors. • Scale of interest. High resolution, long time scales, etc. • Accuracy • Available machine cycles. • Cache • Vectors • Communications • Processor configuration (# of PEs, # of nodes, etc.)
Conclusions • Climate change prediction is a “Grand Challenge” modeling problem. • Large scale multidisciplinary research requiring a mix of physical and computational scientists. • The path for the modeling future is relatively clear. • Higher resolution Regional climate change prediction • Larger ensembles, longer control runs, more parameter studies quantify uncertainty in predictions • More sophisticated physical parameterizations better simulation of the real system • All of this requires substantial increases in US investments in hardware and software.
Editorial comment • My generation has only identified that there is a problem. • We leave it to your generation to do something about it.
Additional climate model resources • Intergovernmental Panel on Climate Change • http://www.ipcc.ch/ • Community Climate System Model • http://www.cgd.ucar.edu/csm • IPCC model data distribution • http://www-pcmdi.llnl.gov • Climate data tools (PYTHON) • http://esg.llnl.gov/cdat • SciDAC Earth System Grid project • CCSM and PCM data distribution • http://www.earthsystemgrid.org • Michael Wehner, mfwehner@lbl.gov