Download
1 / 1
10 likes | 200 Vues
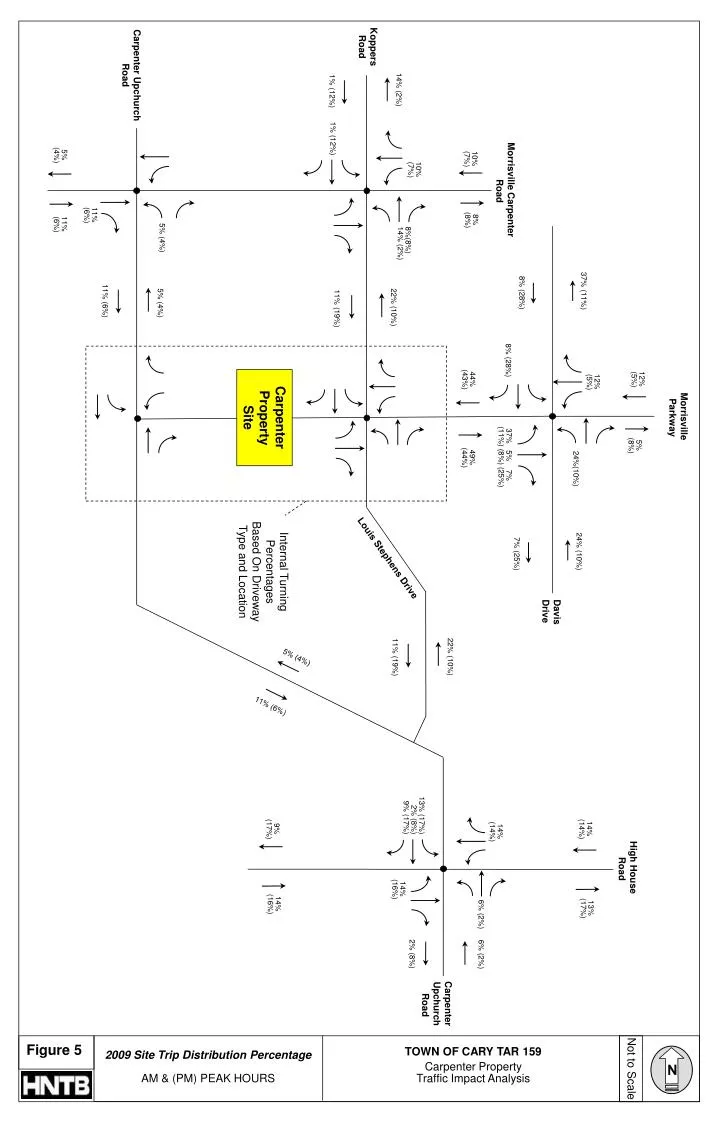
N. Morrisville Parkway. 12% (5%). 5% (8%). High House Road. 12% (5%). 13% (17%). 14% (14%). 24% (10%). 37% (11%). 24%(10%). Davis Drive. 8% (28%). 7% (25%). Morrisville Carpenter Road. 37% 5% 7% (11%) (8%) (25%). 8% (28%). 14% (14%).

E N D
N Morrisville Parkway 12% (5%) 5% (8%) High House Road 12% (5%) 13% (17%) 14% (14%) 24% (10%) 37% (11%) 24%(10%) Davis Drive 8% (28%) 7% (25%) Morrisville Carpenter Road 37% 5% 7% (11%) (8%) (25%) 8% (28%) 14% (14%) TOWN OF CARY TAR 159 Carpenter Property Traffic Impact Analysis 6% (2%) 6% (2%) 8% (8%) 10% (7%) 44% (43%) 49% (44%) 22% (10%) Carpenter Upchurch Road 13% (17%) 2% (8%) 9% (17%) 10% (7%) 2% (8%) 8%(8%) 14% (2%) 14% (2%) 14% (16%) 11% (19%) 22% (10%) Louis Stephens Drive Koppers Road 1% (12%) 11% (19%) 1% (12%) 14% (16%) 9% (17%) Internal Turning Percentages Based On Driveway Type and Location Carpenter Property Site 2009 Site Trip Distribution Percentage AM & (PM) PEAK HOURS 5% (4%) 5% (4%) 5% (4%) Carpenter Upchurch Road 11% (6%) 11% (6%) 11% (6%) Figure 5 5% (4%) 11% (6%) Not to Scale