Download
1 / 40
400 likes | 519 Vues
Baltimore’s Workforce System at Work: First Year’s Highlights by Chris Thompson , Ph.D. Institute for Policy Studies, Johns Hopkins Univ., BWIB Workforce System Effectiveness Committee (410/516-8740, chris.thompson@jhu.edu) Presentation to the Forum of the:

E N D
Baltimore’s Workforce System at Work: First Year’s Highlights by Chris Thompson, Ph.D. Institute for Policy Studies, Johns Hopkins Univ., BWIB Workforce System Effectiveness Committee (410/516-8740, chris.thompson@jhu.edu) Presentation to the Forum of the: Baltimore Job Opportunities Task Force (http://www.jotf.org) (June 15, 2004)
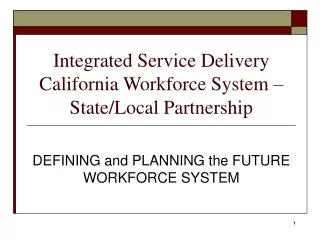
Objectives of today’s presentation • Provide an overview of the work of the Baltimore Workforce Investment Board’s “Workforce System Effectiveness Committee” (WSEC) • Present highlights and main findings of WSEC’s first Baltimore’s Workforce System at Work report. • Highlight two useful approaches to the question “how are we doing?”: Benchmarking and ROI • Have other speakers and audience react to recommendations in the Report and suggest “where do we go from here?”
Workforce Investment Act (WIA) of 1998 Replaced previous JTPA/PIC system with: • Demand-driven approach • PICs/SDAs replaced with SWIBs/LWIBs • Private employer majority boards • Seamless integrated services accessed through comprehensive one-stop centers • 3 tier model: “core”–“intensive”–“training” • free universal access to core services • eligible training provider lists and ITAs • performance-based, outcome-focused
The Baltimore performance space (Advocacy) BWIB (Operations) OSI-B BMOED Abell WSEC CAREER CENTER NETWORK 1-stop 1-stop UB-JFI 1-stop 1-stop (Research)
WIA 3 step service delivery model Self-/Staff-assisted CORE INTENSIVE TRAINING Job Search Labor Market Information Information Sessions Computer Services Comp. Assess. Employ. Plan Counseling Case Mgmt. Job Readiness Adult Ed. & Literacy • Occup. Skills • Customized • ITAs Placement Assist. Career Counsel. Assessment Retention Referral
WIA Service Providers CORE INTENSIVE TRAINING MOED One-Stop Centers BCPSS Goodwill AFL-CIO BCCC DORS DLLR DSS Baltimore Reads Catholic Charities GI Tech MOED One-Stop Centers The Genesis Group BCCC All-State Career Goodwill Indust. MD Beauty School Medix Broadcast. Institute American Red Cross CCBC TESST MCAT
Customer flow/process mapping study Client cohort outcomes and employer characteristics Return on training investment pilot Performance support plans for intensive services contractees Private sector performance practices 6. Comparable cities benchmarking 7. Responses to extreme fiscal stress 8. Role of temporary help supply/staffing industry 9. Identification of employer needs 10.‘State of the Workforce System Report’ Two-year WSEC workplan of performance support projects
Sponsors and authors Sponsors: • The Abell Foundation • The Open Society Institute-Baltimore • The Mayor’s Office of Employment Development Contributing authors: • Burt Barnow (JHU), David Bosser (JOTF), Pat Jackson (MOED), Pamela Paulk (JHU Hosp), Deborah Povich and Chauna Brocht (JOTF), Donna Safely and Diana Spencer (MOED), David Stevens (UB), WSEC members
Objectives of the Report • Provide an overview of “One-Stop Career Center Network” structure, services, customers, performance (not including other parts of the workforce system). • Be a primer for new/prospective Board members. • Report progress with multiple WSEC studies. • Make findings-based recommendations for Board consideration.
Report structure 1. The workforce landscape • unemployment, projections, review of existing work 2. Local One-Stop Career Network at work • role of the Board; system and services; client flow and demographics; employer analysis; comparable city benchmarking; training investment analysis (cost-effectiveness and ROI) 3. Future opportunities and recommendations - strategies, sector/cluster-based approaches, develop more training funds, modern performance measurement /management system.
The Workforce Landscape • City’s total labor force (Apr ’04) = 288,400 Employed = 266,962, Unemployed = 21,438 (monthly average rate for ’04 = 8.0%); • City’s unemployment rate has fluctuated between 7.2% and 9% in last 3 years: Dec ’03 was 7.8%, compared to 4.7% for Gtr. Balto. metro area; • manufacturing provided 20% of all jobs in the City in 1970, but only 8% today;
The Workforce Landscape • health, education, social services are now over one quarter of all jobs (second only to Boston); • these new opportunities require higher training/educational preparation to participate; • c.132,000 adults over age 25 lack post-secondary qualification (2000 Census);
(2) Local One-Stop Career Center Network at Work: general findings
General findings • ‘One-Stop Career Center Network’ served 21,361 adult job-seekers (100% received self-service core services) and 1,260 youth in first 18 months; • snapshot tally of over 4,000 formally registered adults: 35% in staff-assisted core, 51% in intensive, 14% in training; • 2,231 employers served in the first year, hiring 6,055 job-seekers at average adult hourly wage of $9.02 (78% w/ benefits); • we do not know as much about outside this part of the system (only $9.1m of $90.3m total in 15 federal funding streams).
(2) Local One-Stop Career Center Network at Work: “comparable cities benchmarking”
The “Benchmarking” concept Theory: • even if no single agreed definitive “best way”, then “best practice” may emerge from observing across a group of like individuals facing same problem • “best in class” performance reveals best practice location Practice: • organizations contribute own data as price of admission to club where see everyone else’s data • need neutral party and ground rules on sharing
“Comparable cities” project • selected 16 comparable LWIBs and compiled data from FutureWorksTM system • put individual results in perspective • compare to peers, not national average • identify different service models • allows ‘reverse search’ for best practices, starting with outcomes
Findings from benchmarking • Overall, Baltimore is a high performer on nearly all federal performance measures, esp: customers served per 100k of pop, credential rate, entered employment rate, earnings change • Measures limited for present management purposes, as based on two-year old untidy data • See hint of different service models possible within WIA 3-tier structure: some other areas appear to do “more” training • Need to follow up with individual cases
(2) Local One-Stop Career Center Network at Work: “Training Investment”
The training investment question: Information on 216 WIA clients who were sent to either “customized training” or “ITA-funded training,” and who exited May 2000-June 2002. “Is all this money we are putting into training paying off from the taxpayer’s point of view, and of the different training types, which is giving us the better returns?”
Cost-effectiveness • Comparative analysis on two samples of 216 trainees showed 4-quarter before/after wage gain of $2.20 for every $1 invested in their training ($3.55 for “customized training”, $1.49 for “ITA-funded”) (see chart);
Return on investment: why do ROI? • as a management tool to guide future resource allocation between alternative investments; • do on pilot basis to ascertain whether ROI canbe done (politically and data-availability); • articulate evaluation in private sector terms; • demonstrate value of workforce system activities and counter negative perception about “government training” • uncover what ROI results are most sensitive to;
What data are included in our ROI? “Actuals,” at the individual SSN level: • Wages: quarterly pre- and post-intervention, (incl. only as starting point for taxes paid) • Public assistance: TANF/TCA, Food Stamps, CCA vouchers • Training cost: course tuition/trainer fee Calculated from demographic, income info: • Tax revenues: federal, state, local income tax • Tax credits: fed/state/city EITC,REITC,PLC
ROI findings • Return on taxpayer’s investment in their training is positive by end of year 2 after customized training, and by end of year 3 after ITA-funded training: hence retention over time is key (see chart);
What else we learned… • Cost-effectiveness analysis is easier to do than full-blown ROI, and may suffice for audience • Training is both cost-effective and equitable • Training outcome differences by client group are generally larger than by training type (social engineering vs. consumer choice?) • 1 in 4 clients shows wage decline after training • Level of wage gain not correlated with cost of training for similar types of training • Public assistance receipt poorly aligned to training • Public costs can be perverse
Critical success factors for doing ROI • willingness to take transparent analytic approach • open cooperation of agency data owners • enough “actual” data to make results more than just product of assumptions • individual-level wage gain and service cost data • multiple administrative data-set warehouse • independent staff, and time to analyze (SPSS/Excel) • start small and branch out, have humility about results, and don’t focus on just “the number”
What are the remaining gaps in knowledge? • client spousal income, ch.dep.care expenses, homeownership, debt/arrearages, all impact taxes/benefits • wage record “data thinning” increases towards present, so retention/longevity only estimated • self-employment income omitted • self-reported income info is highly suspect • sunk costs in previous service tiers, one-stop personnel/admin, employer costs, medicaid, other community costs/benefits, discount rate, all omitted
What are the remaining gaps in knowledge? • no obvious “control” group • no random selection of individuals for training type • results apply to these samples only • no consideration of “other” training under the present incremental service • extending ROI to other service tiers would require significantly more data-gathering at individual level
What impacts do we hope our ROI results might have? • more emphasis in future on cultivating customized training opportunities • raised issue of client allocation to training types • raised issue of getting a retention-over-time commitment from employers, to make sure “positive returns” zone is reached • greater respect from private sector • receiving enquiries on “how to do it/build it in,” suggesting possible system change in thinking
For further info on ROI: Thompson C, et al(2004) Baltimore’s Workforce System at Work, draft final report by the BWIB Workforce System Effectiveness Committee (avail. July ’04) Phillips J (1997) Return on Investment, Butterworth-Heinemann/Gulf, Houston, TX. Benson D and Tran V (2002) “Workforce Development ROI”, pp173-197 in Phillips J and Phillips P (2002) Measuring ROI in the Public Sector, ASTD Books, Alexandria, VA. King C, et al (2003) “Estimating ROI for Texas Workforce Development Boards” and “ROI Estimates for Workforce Services in Texas, State FY 2000/01”.
Recommendations in the Report
3 main recommendations of Report 1. Expand opportunities within high-growth target industries out to a larger sector/cluster, creating entry/attachment points for low-skilled. 2. Greatly increase skills training through significant additional sources of funds. 3. Institute a modern local performance measurement system.
Research questions for the future 1. What goes on “outside” the One-Stop Career Center Network? 2. How much workforce training is actually being done in the City? What are the workforce training needs? 3. How do we fund workforce training at a larger scale and more creatively, especially for the lowest-skilled?