Download
1 / 24
250 likes | 500 Vues
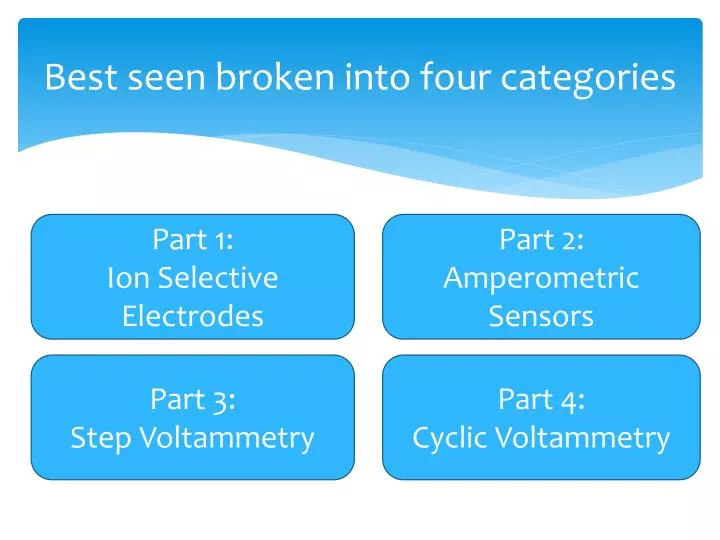
Best seen broken into four categories. Part 1: Ion Selective Electrodes. Part 2: Amperometric Sensors. Part 3: Step Voltammetry. Part 4: Cyclic Voltammetry. (3) Step Voltammetry. Why Voltammetry at all? Isnt ISE / Amperometrics good enough? According to the Prof – apparently not!

E N D
Best seen broken into four categories Part 1: Ion Selective Electrodes Part 2: Amperometric Sensors Part 3: Step Voltammetry Part 4: Cyclic Voltammetry
(3) Step Voltammetry Why Voltammetry at all? Isnt ISE / Amperometrics good enough? According to the Prof – apparently not! Reduction potentials and electron stoichiometry of redox reactions Reversibility of redox reactions undergone by a molecule Diffusion coefficients of species in stable oxidation states
Step Voltammetry Eelectrode / V 0.5 0.1 What does excitation profile look like? -0.3 Time / s [O] = 5 mM Can be reduced to R via O + e- R E0 (standard reduction potential) = - 0.1 V Solution stirred continuously
Step Voltammetry I / A 0 What form does current vs time take? What about when [O] = 2.5 mM ? What about if solution unstirred ([O] = 5 mM) ? Time / s [O] = 5 mM Can be reduced to R via O + e- R E0 (standard reduction potential) = - 0.1 V Solution stirred continuously
Elementary Steps of an Electrode Reaction Oxidised species heads towards interface Mr. Electrode Reduced species heads into bulk solution e Mr. Electrode donates electron to oxidised species Stirrer Bulk solution Interface
Mass Transport Eelectrode +ve Mr. Electrode E0 -ve time Concentration Gradients
Cottrell Equation |i| Current Magnitude t Time D0 Diffusion Coefficient
Question The excitation profile shown below was applied to an unstirred solution containing 1 mM Aand no A-. What will the current-time profile look like? The excitation profile shown below was applied to an unstirred solution containing 1 mM A- and no A. What will the current-time profile look like? A + e- A- has E0 = -0.1 V vs SHE
|i| = nFAkhet(E)Canalyteat electrode surface Accounting for Potential Dependence of the Current
Questions The excitation profiles shown on the right were applied to an unstirred solution containing 100% of the oxidised form of a Mn complex in two independent, but otherwise identical, experiments. What will the current vs. time profile look like in each case?
Questions The excitation profiles shown on the right were applied to a stirred solution containing 100% of the reduced form of a Mo complex in two independent, but otherwise identical, experiments. What will the current versus time profile look like in each case?
Questions The excitation profiles shown on the right were applied to an unstirred solution in two independent, but otherwise identical, experiments. The solution contained 50% of the oxidised form of an Fe complex and 50% of the reduced form of this complex. What will the current versus time profile look like in each case?
Best seen broken into four categories Part 1: Ion Selective Electrodes Part 2: Amperometric Sensors Part 3: Step Voltammetry Part 4: Cyclic Voltammetry
(4) Cyclic Voltammetry I (A) E (V) +ve +ve 0 E0 -ve -ve time time Also known as Linear Sweep Note: Gradient ( = scan rate
Why a peak shape??? Ultimately leads to formation of cyclic voltamogram
How to read cyclic voltammograms Reversibility If the reaction is fully reversible
How to read cyclic voltammograms Reduction Potential Average peak of the peak potentials
How to read cyclic voltammograms Electron Stochiometry Defined by separation of the peak potentials
Examples How many redox active centres in buckminsterfullerene? Buckminsterfullerene
Effect of Scan Rates Diffusion Coefficients A Electrode Area D0 Diffusion coefficient v Scan rate CO Concentration n Electron Stoichiometry of redox reaction
Effect of Scan Rates Electron Transfer Kinetics
Effect of Scan Rates Reaction Mechanism