Download
1 / 24
240 likes | 381 Vues
On S ome P rospects of the LOFT M ission : QPO Models. Gabriel Török. Institute of Physics, Silesian University in Opava. CZ.1.07/2.3.00/20.0071 Synergy , GAČR 209/12/P740 , 202/09/0772, SGS-01-2010 , www. physics.cz. 1. Introduction. MOTIVATION. Compact object:

E N D
On SomeProspects of the LOFT Mission: QPO Models Gabriel Török Institute ofPhysics, Silesian University in Opava CZ.1.07/2.3.00/20.0071Synergy , GAČR 209/12/P740, 202/09/0772,SGS-01-2010, www.physics.cz
1. Introduction • MOTIVATION Compact object: - black hole or neutron star(>10^10gcm^3) • LMXB Accretion disc LMXBs • T ~ 10^6K • >90% of radiation • in X-ray • Companion: • density comparable to the Sun • mass in units of solar masses • temperature ~ roughly as the T Sun • more or less optical wavelengths Observations: The X-ray radiation is absorbed by the Earth atmosphere and must be studied using detectors on orbiting satellites representing a rather expensive research tool. On the other hand, it provides a unique chance to probe effects in the strong-gravity-field region (GM/r~c^2) and test extremal implications of General Relativity(or other theories). Figs:space-art,nasa.gov
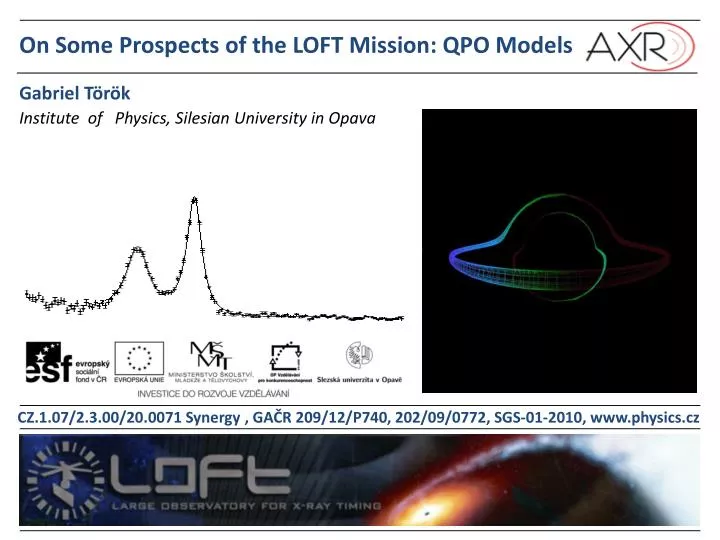
1. Introduction • MOTIVATION Individual peaks can be related to a set of oscillators, as well as to time evolution of a singleoscillator. LMXBsshort-term X-ray variability: peaked noise (Quasi-PeriodicOscillations) Sco X-1 power • LowfrequencyQPOs (up to 100Hz) • hecto-hertz QPOs (100-200Hz),... • HF QPOs (~200-1500Hz): • Lower and upper QPO feature • forming twin peak QPOs frequency The HF QPO origin remains questionable, it is most often expected that it is associated to orbital motion in the inner part of the accretion disc. Fig:nasa.gov
2. LOFT • LOFT isspecificallydesigned to exploitthediagnosticsofvery rapid X-rayfluxandspectral variability(alreadyknown to exist) thatdirectlyprobethemotionofmatterdown to distancesveryclose to blackholesand neutron stars. Itsfactorof ~20 largereffective area thanRXTE’s PCA (thelargest area X-ray instrument everflown) iscrucial in thisrespect. • (from LOFT webpage)
2. LOFT • LOFT/LAD’s much improvedenergyresolution (betterthan 260 eV) compared to thatof RXTE/PCA willalsoallowthesimultaneousexploitationofspectraldiagnostics, in particulartherelativisticallybroadened 6-7 keVFe-K lines. Thetimescalesthat LOFT willinvestigaterangefromsubmillisecond quasi-periodicoscillations (QPOs) to yearslongtransientoutbursts. LOFT isrequired to answertwofundamentalquestionsof ESA's Cosmic Vision ThemeMatterunderextremeconditions: • Doesmatterorbitingclose to theeventhorizonfollowthepredictionsofgeneral relativity? • Whatistheequationofstateofmatter in neutron stars? • (from LOFT webpage)
3. LOFT & QPO Models (SFG1 Group Goals) (Severalof) CompetingmodelsvariouslyidentifyobservedQPOswiththerelativisticradialandverticalepicyclicfrequenciesorrelativisticnodalandperiastronprecession. Veryhigh-signal-to-noise LOFT/LAD measurementsoftheQPOswillunambiguouslydiscriminatebetween such interpretationsand in theprocessteaseoutyetuntestedgeneralrelativisticeffects such as framedragging, strong-fieldperiastronprecession, andthe presence ofaninnermoststable orbit.Crucially, LOFT willprovideaccessforthefirsttime to typesofinformation in these signalsthat are qualitativelynewdue to thecapability to measuredynamicaltimescalephenomenawithintheircoherencetime, whereso far onlystatisticalaveragesofsignalswereaccessible. Thiswillallowstudiesthatdirectlywitness QPO formationandpropagationandtie in withwhatstate-of-the-artnumericalworkis just beginning to address. (from LOFT webpage)
3. LOFT & QPO Models (SFG1 Group Goals) Veryhigh-signal-to-noise LOFT measurementsoftheQPOswillunambiguouslydiscriminatebetween QPOinterpretations. “Modelspredictfrequenciesbutgiveverylittleinsights on amplitude - Itishoweverlikelythatweseethe tip oftheiceberg (thefundamental, whichisactuallyclose to the PCA sensitivity) andthattheclueis in theharmoniccontentofthesignal, andthisis a problem, becausewe don't knowatwhichamplitudelevelstheywill show up.” (from SFG1 materials)
3. LOFT & QPO Models (SFG1 Group Goals) Veryhigh-signal-to-noise LOFT measurementsoftheQPOswillunambiguouslydiscriminatebetween QPOinterpretations. Lightcurvescorresponding to differentdiscoscillationmodes and lightcurvescorresponding to hot-spot models should be modelled including boththecurrentmodelsandthe process of observation in order to obtain relevant PDS.
4. LightcurveModelling: ImplementationBasis& “Reverse Engineering” • COLLABORATION: • Pavel Bakala, Vladimír Karas, Michal Dovčiak, Martin Wildner, Dalibor Wzientek, Marek Abramowicz, Eva Šrámková, Kateřina Goluchová, Frederic Vincent, Grzegorz Mazur • Institute ofPhysics, Silesian University in Opava, CZ • Astronomical Institute, Prague, CZ • CopernicusAstronomical Center, Warszawa, PL • Institute forTheoreticalPhysics, University ofWarsaw,PL • LaboratoireAstroParticuleetCosmologie, CNRS, Universite Paris Diderot, FR
4. LightcurveModelling: ImplementationBasis& “Reverse Engineering” Global Empirical Model of Variability and Spectra (GRS 1915+105, SPL State) TOTAL SOURCE FLUX MODEL + QPO MODEL
4. LightcurveModelling: ImplementationBasis& “Reverse Engineering” Global Empirical Model of Variability and Spectra (GRS 1915+105, SPL State) TOTAL SOURCE FLUX MODEL + QPO MODEL
4. LightcurveModelling: ImplementationBasis& “Reverse Engineering” Response Matrices (Detector) Global Empirical Model of Variability and Spectra (GRS 1915+105, SPL State) TOTAL SOURCE FLUX MODEL + “DATA” Time and Spectral Distribution of Detected Counts RESULTS QPO MODEL TIMING ANALYSIS
5. Some Results: SignalStrength Model: Single spot orbitingclose to inneredgeoftheaccretiondisc (simulationusing KY Spot code). Expectation: Keplerianfrequency+ harmonics
5. Some Results: SignalStrength Model: Single spot orbitingclose to inneredgeoftheaccretiondisc (simulationusing KY Spot code).[~1Crab source countrate] Expectation: Keplerianfrequency+ harmonics Signal Strength (relative hot-spot brigthness)
5. Some Results: SignalStrength Model: Single spot orbitingclose to inneredgeoftheaccretiondisc (simulationusing KY Spot code).[~1Crab source countrate] Expectation: Keplerianfrequency+ harmonics Signal Strength
5. Some Results: SignalStrength Model: Single spot orbitingclose to inneredgeoftheaccretiondisc (simulationusing KY Spot code).[~1Crab source countrate] Expectation: Keplerianfrequency+ harmonics
5. Some Results: SignalStrength Model: Single spot orbitingclose to inneredgeoftheaccretiondisc (simulationusing KY Spot code).[~1Crab source countrate] Expectation: Keplerianfrequency+ harmonics
5. Some Results: SignalStrength Model: Single spot orbitingclose to inneredgeoftheaccretiondisc (simulationusing KY Spot code).[~1Crab source countrate] Expectation: Keplerianfrequency+ harmonics
5. Some Results: SignalStrength Current BH status: weak signal with sporadic RXTE QPO detections - The applied simple model clearly illustrates the LOFT capability in such situation.
5. Some Results: ComparisonBetween QPO Models RXTE simulations LOFT simulations Multiple spostcreatedaroundtwopreferred radii (using KY Spot code). SPOTS (ISCO, nurmax) SPOTS (ISCO, nurmax) M = 11M⊙, D = 65°, a = 0, R1= 6M, R2=8M, n=0.1. Power Power Frequency Frequency Them=0 epicyclic oscillations of the opticallythin torus driftingthrough theresonantradius. Torus (EpicyclicModes) Torus (EpicyclicModes) Power Power M = 5.6M⊙, D = 65°, a = 0, R0= 10.8M, n=0.1. Frequency Frequency
5. Some Results: ComparisonBetween QPO Models RXTE simulations LOFT simulations Multiple spostcreatedaroundtwopreferred radii (using KY Spot code). SPOTS (ISCO, nurmax) SPOTS (ISCO, nurmax) M = 11M⊙, D = 65°, a = 0, R1= 6M, R2=8M, n=0.1. Power Frequency Frequency Them=0 epicyclic oscillations of the opticallythin torus driftingthrough theresonantradius. Torus (EpicyclicModes) Torus (EpicyclicModes) Power Power M = 5.6M⊙, D = 65°, a = 0, R0= 10.8M, n=0.1. Frequency Frequency
5. Some Results: ComparisonBetween QPO Models RXTE simulations LOFT simulations SPOTS (ISCO, nurmax) SPOTS (ISCO, nurmax) Power Power Frequency Frequency Torus (EpicyclicModes) Torus (EpicyclicModes) Power Power Frequency Frequency
5. Some Results: ComparisonBetween QPO Models RXTE simulations LOFT simulations SPOTS (ISCO, nurmax) SPOTS (ISCO, nurmax) Power Power Frequency Frequency GR Torus (EpicyclicModes) Torus (EpicyclicModes) Power Power Frequency Frequency
END Thankyouforyourattention…