Chapter 8 Climatic Zones and Types
430 likes | 1.81k Vues
Chapter 8 Climatic Zones and Types. Physical Geography A Landscape Appreciation, 9/e Animation Edition. Victoria Alapo, Instructor Geog 1150. Climatic Zones and Types. Climatic Classification & Climographs Tropical Humid Climates (Zone A) Dry Climates (Zone B)

Chapter 8 Climatic Zones and Types
E N D
Presentation Transcript
Chapter 8 Climatic Zones and Types Physical Geography A Landscape Appreciation, 9/e Animation Edition Victoria Alapo, Instructor Geog 1150
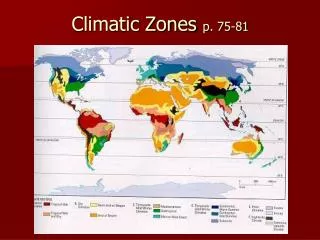
Climatic Zones and Types • Climatic Classification & Climographs • Tropical Humid Climates (Zone A) • Dry Climates (Zone B) • Mild Midlatitude Climates (Zone C) • Severe Midlatitude Climates (Zone D) • Polar Climates (Zone E) • Highland Climate (Zone H)
Climate Classification • Classification Schemes • Ancient Greek System • Köppen System / Modified Köppen System • Climographs
Ancient Greek Classification 5 Basic Climate Zones
Modified Köppen System Wladimir Koppen (1846-1940) was a Russian born German who came up with this system in 1918. He was a climatologist and amateur botanist. That is why his classification follows vegetation types, in addition to temperatures and precipitation. There are 5 major classes which are broken down further. This modified version shows an “H” group, added later by an American climatologist.
Hypothetical Koppen What the Koppen classification would look like if there was only one “super continent” (pg 246). This will also be in your labs. Also, see pg 213-217, for the descriptions of each letter.
Climographs A simple graph showing average monthly temp and precipitation for a specific weather station / location (usually a city). It is also used to classify climate, as you will see in the labs. It consists of a line graph for temp and bar graphs for precipitation (one for each month). This one is on pg 216. See the website (below) for an Omaha climograph. http://www.hprcc.unl.edu/stations/index.php?action=metadata&network_station_id=256255
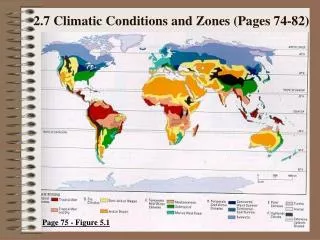
Tropical Humid Climates (Zone A) • Zone A is the wettest, found around the equator, and close to the ITCZ. The only truly winterless region of the world. These areas are always warm, however, they are not the hottest places on earth. They are classified into 3, based on annual rainfall. See Fig 8-6 for distribution. • Tropical Wet (Af) – rain averages over 2.5” per month; 80 degrees F, average temp . Seasonless; smallest annual temp range. • Tropical Monsoon (Am) – distinct dry season; monthly rain is below 2.5”, but very rainy wet season, when it’s much higher (e.g. India). • Tropical Savanna (Aw) – longer dry season of 3-6 months, and prominent (but not extraordinary) wet season. E.g. large part of Africa, including Nigeria • See pg 217, Table 8-3 for Summary (you will need these for labs).
Tropical Savanna and the ITC The ITCZ moves during the year based on the seasons. And the AW climate in particular coincides with these 2 boundaries.
Dry Climates (Zone B) • Zone B is the driest, and covers 30% of the planet, more area than any other zone. They are caused by the STHs (see next slide), which produce high pressure, persistent stability, forcing air to stay close to the ground. • The main difference btw deserts and steppes is that deserts are arid (dry); less than 10” per year, while steppes are semi-arid, i.e., receiving btw 10-25” per yr (see climographs on next slides). So most deserts are surrounded by steppes. See Fig 8-14, pg 223. Summary on pg 223. • The diurnal difference in temps can be VERY large in the B zone. See pg 222 for world’s greatest records. • Subtropical Desert (BWh) • Subtropical Steppe (BSh) – boundary • Midlatitude Desert (BWk) • Midlatitude Steppe (BSk) – boundary
Influence of Subtropical Highs STHs coincide with all the world’s majordeserts. Pg 224. Although some deserts (like the U.S.) are caused by the orographic effect. There are even “marine deserts”, close to the oceans! The ocean’s moisture has no effect, the high pressure anticyclonic activity overrides it. And most of those are cool currents anyway. See S/America, pg 226. The Sahara and Arabian Desert cover more than all deserts combined.
Dry Climates (Zone B) Notice the temperature lines! What’s going on? See pg 227 for steppes.
Subtropical Desert and Steppe It rains here occasionally. Above is a desert (Namib). Picture on right is steppe.
Midlatitude Desert and Steppe It rains or snows here occasionally. Above is a desert (Arizona). Right is steppe (Montana).
Mild Midlatitude Climates (Zone C) • Found 30 to 60 degrees N & S. See pg 229, Fig 8-23. Here, winters are short and mild, summer are hot and long. • Divided into 3 based on precipitation and summer temps • Mediterranean (Csa, Csb) • Humid Subtropical (Cfa, Cwa, Cwb) • Marine West Coast (Cfb, Cfc)
Mediterranean (Csa, Csb) They have much milder summers and winters than other sub-categories in Zone C. Found on the western side of continents. Av. annual precip is 15” (close to equator) and 25” (close to poles).
Humid Subtropical (Cfa, Cwa, Cwb) Found on the eastern side of continents, and more extensive. Humidity is higher, so the temps feel higher (e.g. Kentucky). Esp. in the Cfa, days are sultry, with little or no relief at night. Mild winters, but occasional cold waves causing severe conditions (e.g. ice). Av. annual precip is 40-60” or more.
Marine West Coast (Cfb, Cfc) Mostly on the west side of continents; influenced by westerlies year round. They don’t have extreme temps, but have high humidity & precip.
Severe Midlatitude Climates (Zone D) • Occurs mainly in the northern hemisphere, because s/hemisphere has limited land masses at those same latitudes (i.e. btw 40 to 70 degrees S). See pg 235, Fig 8-31. • In this region, continentality is the key word. It means being remote from the oceans. Land masses here are broader than anywhere else. • As a result, there are broad annual temp fluctuations, i.e. ranges • Divided into 2 based on temps: • Humid Continental (Dfa, Dfb, Dwa, Dwb) • Subarctic (Dfc, Dfd, Dwc, Dwd)
Humid Continental Long, warm summers. E.g. Nebraska, New York, and many New England states. Annual precip is btw 20-40” (highest on the coast and decrease inland). Dominated by westerly winds, so the east coasts are still cold (blows wind from overland). Usually 1 to 5 months below freezing. Winter temps rapidly decrease northward. Snow can cover the ground for 2-3 weeks in the southern margin, and up to 8 months in the northern margin! See Fig 8-34, pg 237.
Subarctic Found btw 50 and 70 degrees North; none in the southern hemisphere. The Needle leaf forest is called the Boreal region in Canada and Taiga in Russia. Winters are long, dark and bitterly cold. For 6 to 7 months, the average temp is below freezing. Coldest months have averages below -36 degrees F. Records are -90 degrees F in Siberia and -82 degrees F in Alaska. Only Antarctica & Greenland are colder than the Subarctic.
Subarctic • Av. Summer temps are upper 50s and 60s, but occasional frosts can occur in any month. Summer is short; winter is dominant. • Note the extreme height of temp graph; this area has the highest annual temp ranges in the world. You can have a diff of 80 degrees btw highest & lowest, and sometimes even 100 degrees. • Low precip – 5” to 20” per yr (highest in coastal areas). A lot of anticyclonic activity. Still enough to support a Taiga forest. • Only 2-3 feet of snow in the winter, but if it snows in October, it could be on the ground until May! This creates a continuous layer of snow on the ground, even though not much is received.
Polar Climates (Zone E) • Caused by low insolation and oblique solar angle. No month has an av. higher than 50 degrees F. Areas of everlasting cold, and extraordinarily dry (high pressure, no uplift). See pg 239, Fig 8-36. • Distinguished based on summer temps: • Tundra (ET) • Ice Cap (EF)
Tundra Tundra has at least one month when av. temp is above freezing; the ice cap does not. The “treeline” is found at the equatorward boundary of the Tundra, where the av. Summer temp is 50 degrees F. It is also the boundary btw the D (Severe Mid-Lat) and the E (Polar) climates. This is the polewardlimit of trees – the last time you see trees, and Koppen noticed that.
Tundra • Interestingly, even though winters are bitterly cold, they are not as severe as they are in the subarctic, even though Tundras are higher up in latitude. This is because of continentality in the subarctic. The temp ranges are also not as high as in the subarctic (D climate). • Long, dark cold winters and brief cool summers. 1-4 months yr, av. temps are above freezing. • Tundra receives little precip, when parts of it are located by the ocean (air is too cold to hold moisture, absolute humidity always low). Anticyclonic activity; no uplift. Annual precip total is less than 10”.
Ice Cap Note the scales of the temp graphs! – mostly negative #s. That station in Greenland is actually colder! Ice cap is the most severe of earth’s climates. Restricted to Greenland & Antarctica, comprising 9% of the earth’s land. All months are below freezing. Perpetual frost; absolutely no vegetation. Permanent cover of snow/ice.
Ice Cap • The cold is even worse because Greenland & Antarctica are both located on plateaus. • In some locations, the warmest months are 0 degrees F. Winter is usually btw -30 degrees F and -60 degrees F. -100 degrees F have been recorded in the interior Antarctic stations. • They are “Polar Deserts” – receiving less than 5” per year (previous graphs). Also, strong surface temp inversions exist most of the time because the air above the ice is very chilled. So it cannot lift. • In addition, heavy, cold katabatic winds flow downslope in an anticyclonic fashion, creating strong winds and blowing snow that you see on TV (e.g. March of the Penguins).
Highland Climate Koppen did not recognize this as a separate category, but other climatologists have. See Fig 8-39, pg 243. Elements affected by highlands include temperature (av. lapse rate), pressure (decreases with height), precipitation (increases with height, and the orographic effect), etc. In highland areas, “altitude is more impt than latitude”.