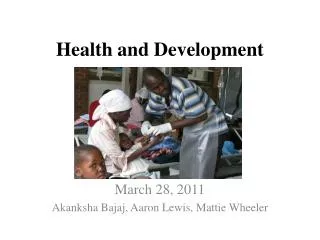
Development and Health
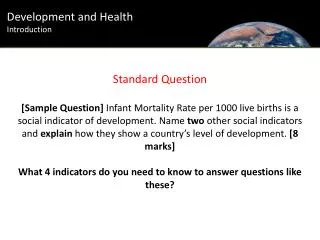
Development and Health. LO – To explore the use of composite indicators of development. Recap. Shouldn’t think of development just as economic growth. It needs to be thought about in terms of social development as well, such as birth rate, death rate, access to education and health care.

Development and Health
E N D
Presentation Transcript
Development and Health LO – To explore the use of composite indicators of development
Recap • Shouldn’t think of development just as economic growth. It needs to be thought about in terms of social development as well, such as birth rate, death rate, access to education and health care.
Physical Quality of Life Index (PQLI) • This composite indicator was first used in 1977. • It combines figures for life expectancy, literacy rate and infant mortality, so doesn’t rely on one indicator. It relies more on social development. • It is calculated by placing a country on a scale from 0 (worst figure) to 100 (best)
The figures are then averaged out. A figure above 77 is satisfactory, whereas below that, the standard of living is poor. • There is a similar link between a high PQLI figure and GNP but there are exceptions such as Argentina which scores higher than expected, and Saudi Arabia scored worse than expected.
These differences come from a variety of ways in which the money is spent within each country, some may focus their incomes on the quality of peoples’ lives whereas others may not.
Human Development Index (HDI) • This was first used in 1990 and attempts to combine social and economic indicators. • This uses the adjusted income per capita (the purchasing power of a given sum within the country), educational attainment (adult literacy rate and average number of years at school) and life expectancy at birth.
The best figure is 1 • The worst is 0 • Each indicator is ranked between these numbers, then averaged out to get the HDI. The advantage of this indicator is that countries can be compared and it can be adjusted for male and female incomes.
There are some links with GNP, so high in UK, Australia and North America but some countries with a low GNP have an average HDI (China). • Limitations are that there is only three sets of data used, and averages can be hidden within the countries.