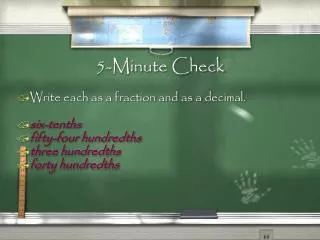
Understanding Fractions, Decimals, and Percent Modeling with 10x10 Grids
This resource focuses on converting decimal numbers into fractions and modeling percentages using 10x10 grids and bar diagrams. Students will practice writing decimals such as 0.85, 0.634, and 6.645 as fractions, alongside their decimal forms. The significance of percentages is illustrated through tiles on a grid, emphasizing that each tile represents 1%. Activities include modeling various percentages (like 36% and 18%) using grids and bar diagrams, enhancing understanding of the relationships between decimal values, fractions, and percentage representations.

Understanding Fractions, Decimals, and Percent Modeling with 10x10 Grids
E N D
Presentation Transcript
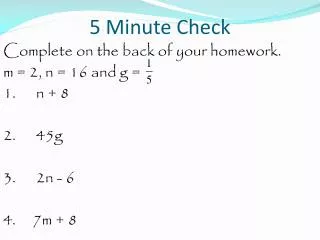
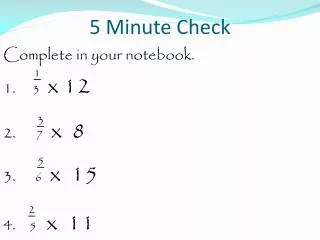
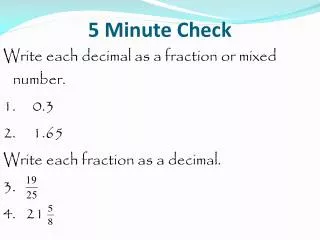
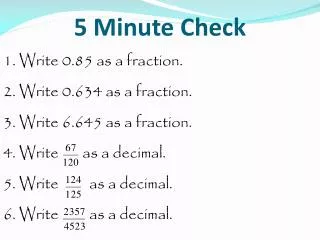
5 Minute Check 1. Write 0.85 as a fraction. 2. Write 0.634 as a fraction. 3. Write 6.645 as a fraction. 4. Write as a decimal. 5. Write as a decimal. 6. Write as a decimal.
5 Minute Check 1. Write 0.85 as a fraction. 2. Write 0.634 as a fraction. 3. Write 6.645 as a fraction. 4. Write as a decimal. 5. Write as a decimal. 6. Write as a decimal.
5 Minute Check 1. Write 0.85 as a fraction. 2. Write 0.634 as a fraction. 3. Write 6.645 as a fraction. 4. Write as a decimal. 5. Write as a decimal. 6. Write as a decimal.
5 Minute Check 1. Write 0.85 as a fraction. 2. Write 0.634 as a fraction. 3. Write 6.645 as a fraction. 6 4. Write as a decimal. 5. Write as a decimal. 6. Write as a decimal.
5 Minute Check 1. Write 0.85 as a fraction. 2. Write 0.634 as a fraction. 3. Write 6.645 as a fraction. 6 4. Write as a decimal. .55833 5. Write as a decimal. 6. Write as a decimal.
5 Minute Check 1. Write 0.85 as a fraction. 2. Write 0.634 as a fraction. 3. Write 6.645 as a fraction. 6 4. Write as a decimal. .55833 5. Write as a decimal. .992 6. Write as a decimal.
5 Minute Check 1. Write 0.85 as a fraction. 2. Write 0.634 as a fraction. 3. Write 6.645 as a fraction. 6 4. Write as a decimal. .55833 5. Write as a decimal. .992 6. Write as a decimal. .5211143046650
Monday, Sept 23 Inquiry Lab Model Percents
Model Percents Objective: To use models to illustrate the meaning of percents.
Model Percents A 10 x 10 grid can be used to represent hundredths. It can also represent percents. The word “percent” (%) means one out of a hundred. For example, 50% means 50 out of a 100.
Model Percents Use a 10 x 10 grid to model 36%.
Model Percents Use a 10 x 10 grid to model 36%. What percent does each tile represent?
Model Percents Use a 10 x 10 grid to model 36%. What percent does each tile represent? 1% In a 10 x 10 grid there are 100 tiles and each tile represents 1%.
Model Percents Use a 10 x 10 grid to model 36%. How many tiles would it take to show 36%?
Model Percents Use a 10 x 10 grid to model 36%. How many tiles would it take to show 36%? 36 tiles
Model Percents Model 18% with a 10 x 10 grid.
Model Percents Model 18% with a 10 x 10 grid. How many tiles need to be shaded?
Model Percents Model 18% with a 10 x 10 grid. Since each tile is 1%, then 18% would be 18 tiles.
Model Percents How would you use a 10 x 10 grid to represent 110%?
Model Percents How would you use a 10 x 10 grid to represent 110%? Since 110% is between 100% and 200%, you would need two 10 x 10 grids.
Model Percents Percents can also be modeled with bar graphs. The entire bar represents 100%. The bar diagram below is divided into 10 equal sections, each representing 10%. How much is the shaded region worth?
Model Percents Percents can also be modeled with bar graphs. The entire bar represents 100%. The bar diagram below is divided into 10 equal sections, each representing 10%. How much is the shaded region worth?
Model Percents Model 60% with a bar diagram. When modeling with a bar graph, the number of sections in the bar must be a factor of 100% and whatever the percent you are trying to represent.
Model Percents Model 60% with a bar diagram. Each section is worth how many percent?
Model Percents Model 60% with a bar diagram. Each section is worth how many percent? 20% How many sections should be shaded?
Model Percents Model 60% with a bar diagram.
Model Percents With a partner and complete page 99 and 100. Write the answers in both math books.
Model Percents Agenda Notes No Homework – Complete In Class Practice 2-1 Due at the end of class or Tuesday, Sept 24