https://fivethirtyeight/features/science-isnt-broken/
https://fivethirtyeight.com/features/science-isnt-broken/.

https://fivethirtyeight/features/science-isnt-broken/
E N D
Presentation Transcript
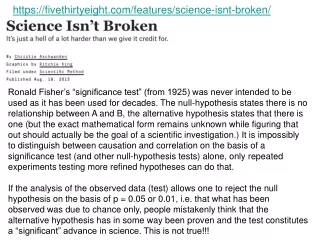
https://fivethirtyeight.com/features/science-isnt-broken/ Ronald Fisher’s “significance test” (from 1925) was never intended to be used as it has been used for decades. The null-hypothesis states there is no relationship between A and B, the alternative hypothesis states that there is one (but the exact mathematical form remains unknown while figuring that out should actually be the goal of a scientific investigation.) It is impossibly to distinguish between causation and correlation on the basis of a significance test (and other null-hypothesis tests) alone, only repeated experiments testing more refined hypotheses can do that. If the analysis of the observed data (test) allows one to reject the null hypothesis on the basis of p = 0.05 or 0.01, i.e. that what has been observed was due to chance only, people mistakenly think that the alternative hypothesis has in some way been proven and the test constitutes a “significant” advance in science. This is not true!!!
p = 0.05 refers to 1 in 20 odds, it’s just called “statistical significance”, but says absolutely nothing about the scientific/practical significance of the investigation and result p = 0.05 does not mean that there is a 95% chance that the alternative hypothesis is correct. It signifies only that if the null hypothesis were true, i.e. no effect or correlation, and all other assumptions that were made during the observation or experiment are indeed valid, there would be a 5 % chance of obtaining a result at least as (or more) extreme as has actually been observed. So it really is a surprise / lack of surprise index, nothing more. When applied as Fisher intended, subsequent null hypothesis test would only be used by the researcher while she or he is working in the early explorative phases on some research question. A p-value would never show up in the final report on the results of the investigation, i.e. paper, because it’s purpose is to help the researcher in figuring out what might be going on. Because many researches misunderstood how his test actually works, and his language “significant” is seductive, i.e. provides what they wanted, we have seen some nine decades of abuse of Fisher’s significance testing scheme.
The smaller the p-value, the less likely an observed set of values, i.e. some relationship between variables, some correlation (or possibly even an apparent causation) is compatible with occurring by chance alone. This is because the null hypothesis was set up as a straw man - to be knocked down by the observation/experiment and statistical analysis of the observed data. The researchers really believe in their alternative hypotheses, i.e. that the set of observed values are not just due to chance or, in other words, that the observed relationship/correlation is not just spurious. This kind of believe is the reason of doing the study/experiment/observation in the first place. Note that only the null-hypotheses get ever tested. The assumptions in the alternative hypotheses do not gain support from rejecting the null-hypothesis because they were never tested in the original Fisher framework (and also not in the Neyman-Pearson framework (from 1933) and any mixture of these approaches that came later and are still taught in college.) By p-hacking, also known as “data dredging”, “snooping”, “fishing”, “significance chasing”, is “fiddling” around with the data until the null-hypothesis can be rejected, one obtains a “statistically significant” result that is possibly completely wrong and meaningless. While this practice constitutes serious scientific misconduct in the natural sciences it often occurs in the social sciences, in studies paid for by Big Pharma, Big Oil, ….
https://fivethirtyeight.com/features/science-isnt-broken/#part1https://fivethirtyeight.com/features/science-isnt-broken/#part1
wild jumps in p-values when more data are included or some data are excluded are precisely what we have seen in the last slide/on the website which is mentioned on that slide !!
Participants had to judge if the scatter-plot are expressions of a linear relationship between X and Y
It is because they use significance and more advanced null-hypothesis testing, start with a research question, e.g. medicine, social sciences, ecology, … often only correlations are found – which are of no use to making progress there are now much better statistical frameworks based on information theory which require detailed mathematical modeling of reasonable models (which can be really difficult) and their comparison, multiple working hypotheses, …
Research that is theory plus controlled experiments (reliable data) driven (rather than just observational) as in the natural sciences is different because the scientific method is used. Also people in natural sciences tend to use better statistical frameworks, are forced to do so, ….
Sure there is fraud, but the scientific method is bound to catch that sooner or later
Sure there are more scientific studies, findings, and papers
Five ways to fix statistics, Nature 551, 357, 2017 (by 5 well known statisticians.) “… a single exposure to the US flag shifts support towards the Republican party for up to eight months.(T. J. Carter et al. Psychol. Sci. 22, 1011 – 1018, 2011). … In our view; this finding has no backing from political-science theory or polling data; the reported effect is implausibly large and long-lasting; the sample sizes were small and nonrepresentative; and the measurement (for example, those of voting and political ideology) were noisy. Although the authors stand by their findings, we argue that their P value provide very little information.” The participants showed republican leanings right from the beginning, i.e. support for the presidential McCain/Palin 2008 ticket, the flag was only 72 by 45 pixels in size.
“… despite widely publicized controversy over their use (Nuzzo, 2014), P-values remain the most common choice for reporting a statistical summary of the relationship between two variables in the scientific literature. In the decade 2000–2010, 15,653 P-values were reported in the abstracts of the The Lancet, The Journal of the American Medical Association, The New England Journal of Medicine, The British Medical Journal, and The American Journal of Epidemiology (Jager & Leek, 2007).” There has not a single p-value been reported in the Springer open journal Advanced Structural and Chemical Imaging, which I co-founded in 2013!
This is both a reasonable result and an illustration that simple hypothesis testing should be discarded in favor of techniques that are based in information theory or the Bayes’ theorem.
Bayes factor = probability ratio for two different hypotheses/models (also called likelihood ratio as unit of likelihood (bits) cancels 100 = 1 10½ ≈ 3.16
A Bayesian approach allows for an evaluation of the question: how does a successful null hypothesis test, i.e. the rejection of the idea that what has been observed was notjust due to chance, depend on the odds that the alternative hypothesis is actually true.
“Consider Motyl's study about political extremists. Most scientists would look at his original P value of 0.01 and say that there was just a 1% chance of his result being a false alarm. But they would be wrong. The P value cannot say this: all it can do is summarize the data assuming a specific null hypothesis. It cannot work backwards and make statements about the underlying reality. That requires another piece of information: the odds that a real effect was there in the first place. To ignore this would be like waking up with a headache and concluding that you have a rare brain tumour — possible, but so unlikely that it requires a lot more evidence to supersede an everyday explanation such as an allergic reaction. The more implausible the hypothesis — telepathy, aliens, homeopathy — the greater the chance that an exciting finding is a false alarm, no matter what the P value is.”
“Critics also bemoan the way that P values can encourage muddled thinking. A prime example is their tendency to deflect attention from the actual size of an effect. Last year, for example, a study of more than 19,000 people showed that those who meet their spouses online are less likely to divorce (p < 0.002) and more likely to have high marital satisfaction (p <0.001) than those who meet offline (see Nature http://doi.org/rcg; 2013). That might have sounded impressive, but the effects were actually tiny: meeting online nudged the divorce rate from 7.67% down to 5.96%, and barely budged happiness from 5.48 to 5.64 on a 7-point scale. To pounce on tiny P values and ignore the larger question is to fall prey to the “seductive certainty of significance”, says Geoff Cumming, an emeritus psychologist at La Trobe University in Melbourne, Australia. Butsignificance is no indicator of practical relevance, he says: “We should be asking, 'How much of an effect is there?', not 'Is there an effect?'”
“Biomedical research generally uses the 2 sigma (p ≤ 0.05) rule; physics required at least 3 sigma p ≤ 0.003).” Five ways to fix statistics, Nature 551, 357, 2017 (by 5 well known statisticians.) the Higgs boson was confirmed with sigma 5
Richard Jones and James Wilsdon, “The Biomedical Bubble: Why UK research and innovation needs a greater diversity of priorities, politics, places and people”, July 2018, free e-book Macleod, M. R., et al. (2014) Biomedical research: increasing value, reducing waste. ‘The Lancet.’ Vol. 383, 101-105, January 2014.
Moore’s law spelled backwards, Note that things have improved slightly in recent years with influx of nano-tech funding
Richard Jones and James Wilsdon, “The Biomedical Bubble: Why UK research and innovation needs a greaterdiversity of priorities, politics, places and people”, July 2018, free e-book
means 7 sigma Actually it’s crucial to understanding what the natural science really are and what the social sciences shall become one day
To natural scientists: the ATLAS/CMS groups failed to falsify the standard model of particle physics so that it continues to be a nice bit of physics and is not to be discarded for now. A more comprehensive theory (perhaps one day of almost anything physical) will probably retain the standard model as a tool for practical work and it will be used in teaching physics as is sums up a large chunk of physics nicely (as do Newton's mechanics, quantum mechanics, general relativity, …., the idea that the Earth revolves around the Sun.
Which I interpret as social sciences do not really have a foundation as secure as physics at present
Summary A p-value of 0.05 does by no means whatsoever imply that there is a 95% chance that the alternative hypothesis, into the confirmation of which the researcher has already made an “investment” of time, money and energy, is correct. This “Fisher-(statistical)-significance-test” value signifies only that if the null hypothesis is indeed true, e.g. no relation between occurrence in two observations (people drowning and eating ice-cream in the summer, no connection between declining populations of storks in some region and declining birth-rates of humans in the same region, and all other assumptions made during the study are indeed valid, there is a 5% chance of obtaining a result as extreme or even more extreme as the one observed.
local crystal phase mapping R. K. Vasudevan et al., Phases and interfaces from real space atomically resolved data: physics based deep data image analysis, Nano Lett.16 (2016) 5574 automatically extracted 2D Bravais lattice types (from discrete Fourier transform) of noisy atomically resolved images, technical possibility of extracting local plane symmetry groups by using their sliding discrete Fourier transform windows approach mentioned, but realization that this“would require substantial efforts at developing the appropriate image classification schemes”
Geometric characteristics of the unit cells of the 5 Bravais lattice types in 2D
b = 52 measured with precision ± 2 2 = 89.6° ± 1° Is this a square? Could be, but more likely it’s a rectangle, e.g. a = 49.5 and b = 51.0, = 90° (by definition) a = 50 measured with precision ± 2 2
Rotation by 90° about the center, does this lead to an equivalence? If it were a unit cell in a 2D periodic array, the array would possess a strong translational pseudo-symmetry while not actually being a square array. Symmetry is qualitative, metric is quantitative. One cannot arrive at a qualitative (definitive) statements from a quantitative real world measurement without using arbitrarily set thresholds. 2ndrotated by 90° 1st original Superposing quadrilateral of last slide with a version of itself that is 90 degrees clockwise rotated around its center does not lead to coincidence. There is no four-fold rotation point at the center of this quadrilateral, so it is not a square.
All point symmetries are broken by noise, but rotation by ± (180 ± 0.5)° about the center leads to “reasonable coincidence”, so we observe a pseudo-point symmetry in the presence of noise only We could express the manifest translational pseudo-symmetry with a set of relative likelihoods objectively, rephrased as model (shape) probabilities, e.g. 30 % square, 50 % rectangle, 15 % rhombus, 5 % parallelogram, for sure not a hexagonal rhombus. Exact values depend on noise level. Anybody is then free to draw her or his own conclusions. Evidence in favor of this quadrilateral being a rectangle is strongest. Besides a fitting metric, it has an approximate two-fold rotation point at its center and approx. perpendicular mirror planes, therefore: “pseudo-point group” 2mm
Farris, F. A. (2015). Creating Symmetry, The artful mathematics of wallpaper patterns, Princeton University Press. contains p31m and is contained in translationengleiche sub-groups p3 and cm (cm contains pg and pm as klassengleiche subgroups, which both contain p1, sure p3 contains p1 as well), p31m is contained in p6mm, so it has a unique place in plane symmetry group hierarchy graph Plane and frieze symmetry groups assignments trivial for noise free images, lead to definitive classifications
trivial when there is no noise, impossible in a strict yes/no sense when there is noise 1D paracrystal or worse Note that the “decision tree” is hierarchic.
implies presence of translation symmetry, i.e. at least plane symmetry p1 Note again that the “decision tree” is hierarchic. V. Ostromoukhov, In: Electronic Publishing, Artistic Imaging and Digital Typography, Lecture Notes in Computer Science 1375, Springer Verlag, pp. 193-223, 1998. trivial when there is no noise, impossible in a strict yes/no sense when there is noise
nicest feature of crystallographic models: they are hierarchic, nested, often non-disjoint alternative names for Bravais lattice types 4 crystal systems (syngonies), 5 Bravais lattice types … means we do not need to know the correct model and its noise level in advance. We can obtain both over geometric AIC “boot strapping”, then move on to relative likelihoods, evidence ratios, relative probabilities that the models minimize Kullback-Leibler information loss (that add to 100 %), ... it suffices to know that “noise” is small (to justify first order approximations) and at least approximately Gaussian. P. Moeck, “Towards generalized noise-level dependent crystallographic symmetry classifications of more or less periodic crystal patterns,” Symmetry, vol. 10, paper 133 (46 pages), 2018, earlier version at http://arxiv.org/abs/1801.01202, both in open access.
Classifications schemes based on information theoretic approaches(late 20th century extensions of Ronald Fisher’s maximal likelihood concepts) Allow for separation of information, i.e. relationships between individual pixel values and noise (non-information, entropy, or variation left unexplained). Instead of modeling the image data itself, e.g. the processes from which it originated and the means by which it got recorded, …, we model the information in the data – that information becomes basis of probabilistic (fuzzy but quantitative) crystallographic classifications.
Machine learning without having figured out first what is to be learned? “As outlined in the review27,28, there are several issues … , most obviously the difficulty in determining the uncertainties in the classification associated with the noise in atomic positions, …”
Note that these authors really refer to the primitive sub-cell of a rectangular centered 2D Bravais lattice (as rhombohedral lattices exist only in three dimensions). Supplementary Figure 5: DCNN Performances tested on simulated data. In this case, a latticewas generated with the lattice vectors of same length, but with the angle varying between 40 and80°. These images were then fed to the DCNN for classification, with 5000 passes through thenetwork to calculate the probability of classification. The prediction probability for the two classesis shown. At 60° one expects hexagonal symmetry to be present. Note that the prediction probabilities are approximately equal to “fair coin-flipping chance”, i.e. 50%, up to about 50° and hexagonal lattices are detected for the wide range of about 60° to 75°, while there should be just one sharp peak in the red (hexagonal) probability curve centered at 60°. Hierarchy of crystallographic symmetries completely ignored.
Kenichi Kanatani’s comments in “Statistical Optimization for Geometric Computation” on approaches such as this from the year 1996: “… those who criticize the statistical approach advocate such non-analytical paradigms as artificial intelligence, fuzzy inference, and neuro-computing. … insufficiency is often concealed by adroit behavior in a heuristically designed system, and its long-term performance is unpredictable – it may suddenly break down when the versatility capacity reaches its limits. This is an inescapable destiny of a system that learns from humans. By careful mathematical analysis, humans can learn much about the mechanisms that underlie seemingly simple phenomena.”
A spokesperson for Google confirmed to Wired that the image categories “gorilla,” “chimp,” “chimpanzee,” and “monkey” remained blocked on Google Photos after Alciné’s tweet in 2015. … It’s not clear in this case whether the Google Photos algorithm remains restricted in this way because Google couldn’t fix the problem, didn’t want to dedicate the resources to do so, or is simply showing an overabundance of caution.
Fig. 1: Results of a survey of the MIT Technology Review (O. Etzioni, “No, the Experts Don’t Think Superintelligent AI is a Thread to Humanity,” MIT Technology Review, September 2016 ) about the feasibility of superintelligence in the future to which eighty fellows of the American Association for Artificial Intelligence contributed.


![[PDF] Free Download Broken Dolls By Sarah Flint](https://cdn4.slideserve.com/8079011/slide1-dt.jpg)