Download
1 / 12
120 likes | 135 Vues
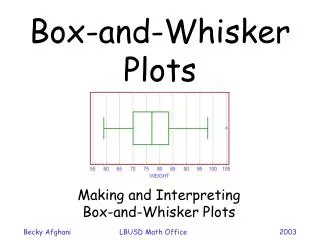
Learn how to construct and interpret box-and-whisker plots, a visual representation of data that includes measures of spread such as the interquartile range.

E N D
Measures of Spread • The range is not a good measure of spread because one extreme, (very high or very low value) can have a big affect. The measure of spread that goes with the median is called the inter-quartile range and is generally a better measure of spread because it is not affected by extreme values.
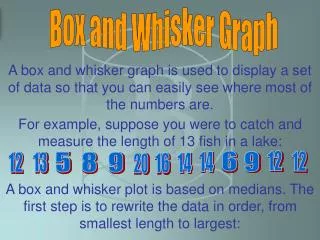
Step 1 – Order Numbers 1. Order the set of numbers from least to greatest
Step 2 – Find the Median 2. Find the median. The median is the middle number. If the data has two middle numbers, find the mean of the two numbers. What is the median?
Step 3 – Upper & Lower Quartiles 3. Find the lower and upper medians or quartiles. These are the middle numbers on each side of the median. What are they?
Step 4 – Draw a Number Line Now you are ready to construct the actual box & whisker graph. First you will need to draw an ordinary number line that extends far enough in both directions to include all the numbers in your data:
Step 5 – Draw the Parts Locate the main median12 using a vertical line just above your number line:
Step 5 – Draw the Parts Locate the lower median8.5 and the upper median14 with similar vertical lines:
Step 5 – Draw the Parts • Next, draw a box using the lower and upper median lines as endpoints:
Step 5 – Draw the Parts Finally, the whiskers extend out to the data's smallest number 5 and largest number 20:
Step 6 - Label the Parts of a Box-and-Whisker Plot Lower Quartile Median Upper Quartile Lower Extreme 3 1 2 Upper Extreme 4 5 Name the parts of a Box-and-Whisker Plot
Interquartile Range The interquartile range is the difference between the upper quartile and the lower quartile. 14 – 8.5 = 5.5


![[12-2B] Box & Whisker Plots](https://cdn3.slideserve.com/6306071/slide1-dt.jpg)