Download
1 / 16
160 likes | 172 Vues
This guide explains how to record observations accurately, draw tables, and create graphs for practical assessments. It covers key points such as table formatting, graph creation, and understanding terms like accuracy and reliability.

E N D
Learning Objective • To understand the requirements for the assessed practicals.
What do I have to do? • The assessment is divided into two parts: • The practical task with associated questions where you may need to draw tables and/or graphs, make observations, draw conclusions and make evaluative comments. • The microscope task where you have to draw something, maybe measure something, identify things, discuss structural features etc…
Skills for observations… • You need to be careful that you are recording your observations in results tables and not your conclusions. • You need to read the practical protocol very carefully and completely before you start. • You need to be aware of what a control is and why it is used. • You will be assessed (by us) on your practical techniques including safety.
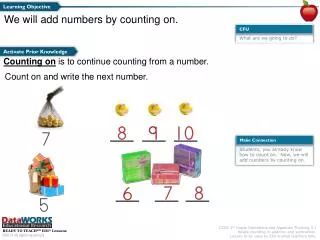
Drawing tables • Draw a table to show the observations from the experiment below: D 0% glucose C 5% glucose A 20% glucose B 10% glucose
Your table... Did you: • Record the colour change rather than the final colour? • Give your table a title? • Rule up your table? Had there been units, where would you have put them?
Tables – some key points Students often: • Put units in the body of the table • Leave out units all together • Do not identify the independent variable by putting it in the first column • Do not ‘rule up’ tables Doing/Not doing these things will cost you marks!
Observations – some key points Students often: • Put ‘clear’ when they mean ‘colourless’ • Record conclusions rather than observations • Record final colour when asked to record colour change • Draw theoretical diagrams rather than what they can actually see • Do not record a difference in reaction – simply whether or not a reaction has occurred.
Checking your graphs Do your graphs have: • Labelled axes? • Units? • Titles? • Do they go through the origin? Should they? • Do they have a line of best fit? What does it look like? • Have you drawn your axes correctly? • Have you got your variables on the correct axis?
Graphs – some key points Students often: • Draw the wrong type of graph • Use inappropriate scales • Put the axes the wrong way round • Do not label axes • Do not give units (or give incorrect ones) • Draw incorrect trend lines
Some very important words You must understand the key terms: • Accuracy • Anomalous • Reliability • Precision • Validity
Accuracy • Students will be expected to appreciate that they accuracy of an observation, reading or measurement is an indication of how close it comes to the ‘true’ value or outcome. • This could refer to: • closeness of data points to a line of best fit • Accuracy of measuring apparatus by % error
Anomalous • Students will be expected to appreciate that an individual result or piece of data may not always match the trend shown by other results. • If this result, after repeats, still appears to be ‘odd’ then it will be considered to be anomalous.
Reliability • Students will be expected to apreciate that a result or data may not always match the trend shown by other results. • The reliability of this data can be measured by carrying out repeats and/or statistical tests (such as the mean or standard deviation) • If, for example, the ‘odd’ result is confirmed to be sound by repeats, then it is not anomalous
Precision • Students will be expected to appreciate that measurements or observations can vary in how exact, definite, clearly stated or able to be reproduced they are • It could also refer to the number of decimal places that a number is expressed in.
Validity • Students will be expected to appreciate that results, measurements or procedures will vary to the extent that they actually measure or carry out what they are designed to do. • Inappropriate measurements or procedures could lead to conclusions that are not valid because they have not done what they set out to do.