Download
1 / 29
290 likes | 300 Vues
Meso- to Submesoscale Variability of Marine Biological Patchiness. David M. Glover Woods Hole Oceanographic Institution Scott C. Doney (WHOI), Alise Wallis (Hunter College) and Norman Nelson (UCSB) This work is supported under NASA NRA-04-OES-02. 10 – 300 km week - months.

E N D
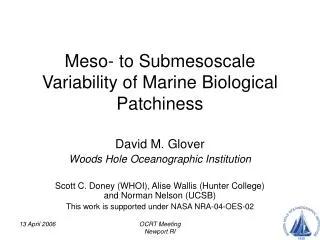
Meso- to Submesoscale Variability of Marine Biological Patchiness David M. Glover Woods Hole Oceanographic Institution Scott C. Doney (WHOI), Alise Wallis (Hunter College) and Norman Nelson (UCSB) This work is supported under NASA NRA-04-OES-02 OCRT Meeting Newport RI
10 – 300 km week - months 0.3 -10 km day - week Provide global and systematic estimates of marine ecosystem responses to submesoscale and mesoscale physical forcing to help understand (model) the temporal and spatial variability of ocean primary productivity and new production. OCRT Meeting Newport RI
Goals • Characterize the submesoscale component of ocean color variability; • Determine the physical-biological mechanisms driving the high frequency ocean color variability; • Quantify the seasonal and interannual variability in the mesoscale biological signals from a global multi-year time-series record. OCRT Meeting Newport RI
Biological Variability • Physical processes on the submesoscale may enhance the biological signal (Levy et al., 2001; Abraham 1998; Martin 2003) • turbulent advection and stirring, ecosystem interactions, unresolved-scale upwelling • We suggest ocean color variability is dominated by submesoscale processes in oligotrophic regimes (Doney et al., 2003) • Objective is to characterize the variability on the submesoscale to gain insight into the processes occurring on this spatial scale. OCRT Meeting Newport RI
Semivariogram Analysis γ*(v) the semivariogram function Z(x) the geophysical data v the “lag” between data points N(v) the number of pairs of data points at lag v The closer two points are, the more similar they appear Robust semivariogram estimator Cressie and Hawkins (1980) Less sensitive to outlying data points OCRT Meeting Newport RI
Geostatistical Jargon Translated Overall Variability → ← Resolved Variability ← Decorrelation Scale ← Unresolved Variability OCRT Meeting Newport RI
Spatial length scale (the point at which data become decorrelated) • Resolved variability (geophysical signal) (Doney et al., 2003) • Unresolved variability (sub-scale or noise). OCRT Meeting Newport RI
OCRT Meeting Newport RI 19 February 2000
Monthly smoothed mean field • 30 day moving average • 20 x 20 pixel block processed OCRT Meeting Newport RI
The anomaly field (daily minus the monthly mean field) Removes the seasonal, large scale trends Initially analyzed by quadrants OCRT Meeting Newport RI
2-D FFT Semivariograms (Marcotte, 1996) OCRT Meeting Newport RI
February 2000 1-D Semivariogram Sargasso Sea OCRT Meeting Newport RI
OCRT Meeting Newport RI
One-dimensional semivariogram for the month of February 2000; • Semivariogram analysiscanextend out to lags of 250 km; • NW quadrant around Bermuda only out to 50 km; • submesoscale behavior of the semivariogram the data points fall off of the simple model at distances of less than approximately 10 km. OCRT Meeting Newport RI
Subtract the 1 km semivariance from the 10 km semivariance and divide by the total variability of the dataset minus the unresolved variability (at 1 km), this yields the percentage of submesoscale variability present. OCRT Meeting Newport RI
OCRT Meeting Newport RI
OCRT Meeting Newport RI
OCRT Meeting Newport RI
OCRT Meeting Newport RI
Data MODIS AQUA (Chl, SST); Historical SeaWiFS (Chl); TOPEX and Jason-1/2 (SLA); SeaWinds/QuikSCAT (U10) Analysis Complete time series of meso- and sub-mesoscale; Improve calculation of daily anomalies; Perform cross-correlation and cross-semivariogram analysis Future Work OCRT Meeting Newport RI
OCRT Meeting Newport RI
Not Quite Ready for Primetime Backup Slides OCRT Meeting Newport RI
OCRT Meeting Newport RI
OCRT Meeting Newport RI
A similarity seen in physical and biological spatial decorrelation length scales; • Suggests, but does not prove, a causative link; • Does not directly address how physical turbulence governs biological spatial scales OCRT Meeting Newport RI
Robust Semivariogram • Robust semivariogram estimator • Cressie and Hawkins (1980) • Less sensitive to outlying data points OCRT Meeting Newport RI
OCRT Meeting Newport RI
OCRT Meeting Newport RI
OCRT Meeting Newport RI