Understanding Probability and Statistics: A Comprehensive Overview
Learn about random variables, probability, mutual exclusiveness, statistical independence, conditional probability, statistical functions, distributions, and averages in statistics. Explore examples and concepts to enhance your statistical knowledge.

Understanding Probability and Statistics: A Comprehensive Overview
E N D
Presentation Transcript
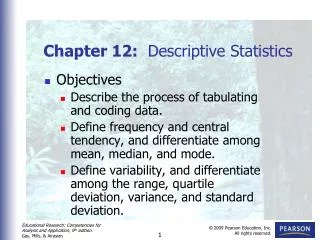
Chapter 12Introduction to Statistics • A random variable is one in which the exact behavior cannot be predicted, but which may be described in terms of probable behavior. A random process is any process that involves one or more random variables. The subjects of probability and statistics are based on a mathematical and scientific methodology for dealing with random processes and variables.
Probability • Probability is associated with the very natural trend of a random event to follow a somewhat regular pattern if the process is repeated a sufficient number of times.
Probability • Assume that the first event occurs n1 times, the second event n2 times, and so on. The various probabilities are then defined as
Example 12-1. For 52-card deck, determine probabilities of drawing (a) red card, (b) a heart, (c) an ace, (d) ace of spades, (e) ace of hearts or the ace of diamonds. (a) (b)
Example 12-1. Continuation. (c) (d) (e)
Mutual Exclusiveness • Let P(A1+A2) represent the probability that either A1or A2 occurs. Two events are mutually exclusive if
Events that are not Mutually Exclusive • If the two events are not mutually exclusive, then the common area must be subtracted from the sum of the probabilities.
Statistical Independence • Let P(A1A2) represent the probability that both A1and A2 occur. Two events are statistically independent if
Conditional Probability • P(A2/A1) is defined to mean “the probability that A2 is true given that A1 is true.”
Example 12-2. What is the probability that a single card will be an ace or a king?
Example 12-3. What is the probability that a single card will be an ace or a red card?
Example 12-4. Two cards are drawn from a deck. The first is replaced before the second is drawn. What is the probability that both will be aces?
Example 12-5. Consider the same experiment but assume the first card is not replaced. What is the probability that both will be aces?
Example 12-6. The switches below are SI and only close 90% of the time when activated. Determine probability that both close.
Example 12-7. The switches are changed as shown. Determine the probability of success.
Discrete Statistical Functions • A discrete variable is one that can assume only a finite number of levels. For example, a binary signal can assume only two values: a logical 1 and a logical 0. To develop the concept, consider a random voltage x(t) that can assume 4 levels. The values are listed below and a short segment is illustrated on the next slide.
Figure 12-6. Number of samples of each voltage based on 100,000 total samples.
Figure 12-7. Probability density function (pdf) of random discrete voltage.
Probability Evaluations • The quantity X represents a random sample of a process. The expression P(X=x) means “the probability that a random sample of the process is equal to x.”
Example 12-8. For the pdf considered earlier, determine the probability values in the statements that follow.
Example 12-9. Determine the probability distribution function of the random discrete voltage.
Statistical Averages of Discrete Variables. • In dealing with statistical processes, there is a difference between a complete population and a sample of a population insofar as parameter estimation is concerned. We will assume here that we are dealing with a complete population. Expected Value or Expectation
Statistical Averages of Discrete Variables. Continuation. Mean Value Mean-Squared Value Root-Mean Square (RMS Value)
Statistical Averages of Discrete Variables. Continuation. Variance Alternate Formula for Variance Standard Deviation
Example 12-10. For pdf of Example 12-8, determine (a) mean value, (b) mean-square value, (c) rms value, (d) variance, and (e) standard deviation.
Binomial Probability Density Function • Consider the probability that in four trials, A will occur exactly twice. The different combinations are as follows: • AABB ABAB ABBA BBAA BABA BAAB
Combinations • The number of combinations of n trials with exactly x occurrences of one of the two outcomes, where x is a non-negative integer no greater than n, is given by
Example 12-11. An unbiased coin is flipped 3 times. What is the probability of getting exactly one head?
Example 12-12. For previous example, what is the probability of getting at least one head?
Continuous Statistical Functions • If the random variable x is continuous over a domain, it can be described by a continuous pdf. The probability of a sample assuming an exact value is 0.
Figure 12-10. Probability of a random sample lying within a domain is the area under the pdf curve between the limits.
Example 12-14. For the pdf of the last example, determine the probability values in the statements that follow. Refer to Figure 12-12 if necessary.