The Triple Bottom Line
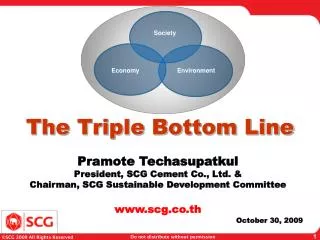
Society. Economy. Environment. The Triple Bottom Line . October 30, 2009. Pramote Techasupatkul President, SCG Cement Co., Ltd. & Chairman, SCG Sustainable Development Committee www.scg.co.th. Why today? Why Triple Bottom Line? or Why Sustainable Development ?. WBCSD 2009

The Triple Bottom Line
E N D
Presentation Transcript
Society Economy Environment The Triple Bottom Line October 30, 2009 Pramote Techasupatkul President, SCG Cement Co., Ltd. & Chairman, SCG Sustainable Development Committee www.scg.co.th
Why today? Why Triple Bottom Line? or Why Sustainable Development ?
WBCSD 2009 Council & Liaison Delegate Meeting Washington D.C. October 12-16, 2009
The Future Society: A Growth Story World population (in Billions): 1950-2050 85% Source: United Nations Population Division, World Population Prospects: The 2006 Revision. Population in less developed countries 15% Population in more developed countries
9 billion peoplewill live on this planet by 2050 . . . . . . will need50% more food, 50% more energy, 30% more freshwater
Urban Future . . . Growth of mega-cities Billions of inhabitants 70% urban 6.4 urban 60% urban rural 5.0 47% urban 3.2 3.3 36% urban 2.9 2.8 1900 2.4 1.3 2050 1970 2000 2030 Source: United Nations, World Urbanization Prospects: The 2007 Revision 2020 70% urban in 2050 Source: Citymayors statistics, 2008 WBCSD 2009 Council & Liaison Delegate Meeting - Washington D.C.
70% of world populationwill live within cities by 2050 Buildings responsible for > 40% of energy used More people, more buildings, more cars, more energy More CO2
The world is not “running out of water,” but it is not always available when and where people need it . . . 2.5% Fresh water but frozen 0.5% Fresh water available 10,217,120 km3 Aquifers (10,000,000 km3) 50% of all drinking water 40% of industrial water 20% of irrigation water • 3,900 children die each day due to dirty water or poor hygiene • 2.6 billion people without improved sanitation and more than 1 billion people without improved drinking water sources reservoirs(5,000 km3) rainfall(119,000 km3) rivers(2,120 km3) 97% Seawater (non-drinkable) Natural lakes(91,000 km3) Source: WBCSD Source: Living Planet Report 2006 Remarks : 1 km3 = 1,000,000,000 cubic meter = 400,000 Olympic size swimming pool
50% rise in cereals demand85% increase for meat demandbetween 2000 & 2030
50% more primary energywill be needed in 2050 Nuclear?CCS (Carbon Capture & Sequestration)?
1.2 billion carswill drive on Earth by 2020 Alternative Energy:Electric & Fuel Cell Vehicles
From 1860-2002 global mean surface temperature increase ~ 1 oC and will reach 2-6 oCin 2100 @2000 ~ 32Gt CO2e Emission @2030 ~ 54 Gt CO2e Emission Difference (OC) from 1961-1990 average 1Gt CO2 ~ 700 conventional 1GW coal fired power stations or 600 million SUVs CO2e : carbon dioxide equivalent Source: Hadley Centre for Climate Prediction and Research, UK Met Office (http://www.metoffice.com)
Global Emission Scenarios Source: IEA. ETP 2008 WBCSD 2009 Council & Liaison Delegate Meeting - Washington D.C.
Shifting Fortunes Emerging economies > 50% of global GDP and trend will continue Source: Angus Maddison, OECD; IMF From The Economist print edition. “Wrestling for influence.” July 3rd 2008. % Share of GDP * At purchasing-power parity WBCSD 2009 Council & Liaison Delegate Meeting - Washington D.C.
Development: The Poverty Challenge Income poverty: • Over 2 billion people live on less than $2/day Energy poverty: • 1.6 billion people today without access to electricity Mobility poverty: • 900 million people without access to transport Water poverty: • 1.8 million deaths per year due to lack of sanitation, poor hygiene and unsafe drinking water. WBCSD 2009 Council & Liaison Delegate Meeting - Washington D.C.
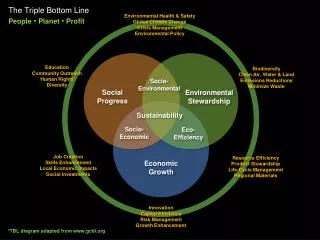
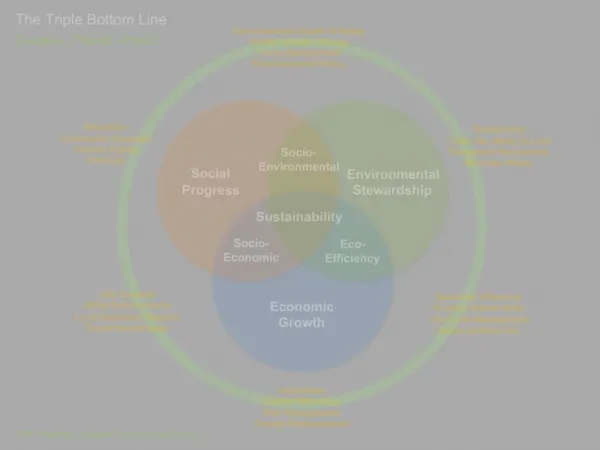
Efficiency Society Economy Environment A world in Transition to Sustainability Geography Solutions Global Local Mindsets Institutions Shared vision Values Technology Regulations Equity Priorities Markets Financing National Regional Infrastructure WBCSD 2009 Council & Liaison Delegate Meeting - Washington D.C.
The world is turning“green” Green Growth & Green Jobs Total stimulus package per capita and green component (US$) Source: HSBC Global Research, UNEP WBCSD 2009 Council & Liaison Delegate Meeting - Washington D.C.
“There is no alternative to sustainable development…. sustainability is now the key driver for innovation. In the future only companies that make sustainability a goal will achieve competitive advantage.” HBR, Sep ’09
Business & Sustainable Development • License to operate, innovate and grow in a world increasingly shaped by sustainable development issues • The world cannot succeed without Business as a committed solution provider to sustainable societies and ecosystems. • Business cannot succeed in a society that fails WBCSD 2009 Council & Liaison Delegate Meeting - Washington D.C.
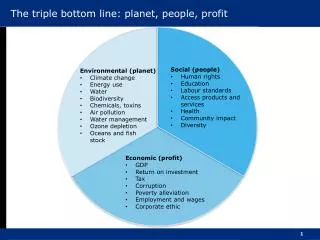
Meaning of SD in SCG context • การดำเนินธุรกิจที่สร้างความสมดุล • ทั้งด้าน เศรษฐกิจ สังคมและสิ่งแวดล้อม Conducting business while balancing the “Triple Bottom Line”, i.e., Economy, Society, and Environment (Profit, People, Planet)
Sustainable Development: SCG Context SD: - Conducting business in harmony with economy, society and environment - Fundamental of business to ensure license to operate, innovate, and grow.
Sustainable Development Business performance Economy Benefit to Macro Economic; GDP, Employment, Tax, etc. Environment Society TQM R & D Intellectual Property Innovation
Sustainable Development Economy Thailand Rescue Robot Championship SCG Badminton Environment Society SCG Sci Camp Scholarships & Donations Key to social responsibilities is to involve the employees in CSR activities & community services
Sustainable Development Economy Conserving water – 10,000 Check Dams Environment Society Natural Resources Conservation Energy Saving • Apply 3Rs Concept • Reduce • Reuse/Recycle • Replenish Biodiversity
Sustainable Development Whistleblower Policy Economy Sustainability Report Environment Society Code of Conduct Corporate Governance E-Policy
& Triple Bottom Line • Economic • Direct economic value generated (Revenues) • Economic value distributed • Employee wage and benefit • Payment to suppliers • Taxes • Governance • CG (Trust & Transparency, Anti-corruption, Antitrust) • Risk • Reporting • Environment • Energy • Climate change • Water management • Waste management • Ecosystem/Biodiversity • Eco-product • Logistics • Social • Community investment & donation • Labor standards & practices • Human rights • Human resource • Stakeholder engagement SCG SD Framework
Safety Semi-open cut mining Biodiversity CO2 Reduction Stakeholders Dialogues Waste Heat Recovery for Power Generation Alternative Fuel Wind Turbine Leading toward sustainable future
√ X √ Car-Free Day - Sept 22, 2009
Thank you Further information: www.scg.co.th