Download
1 / 24
240 likes | 351 Vues
This study presents a detailed radiation damage modeling framework for both n-type and p-type silicon detectors, developed within the RD50-CERN Collaboration. The research encompasses the creation of 3-level models for n-type silicon and 2-level models for p-type silicon, utilizing ISE-TCAD for simulations. Key aspects include damage modeling, charge collection efficiency simulations, and the impact of radiation on leakage current, depletion voltage, and charge collection. Findings support understanding of detector performance in high-radiation environments, optimizing functionality for particle detection.

E N D
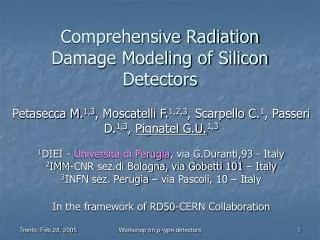
Comprehensive Radiation Damage Modeling of Silicon Detectors Petasecca M.1,3, Moscatelli F.1,2,3, Scarpello C.1, Passeri D.1,3, Pignatel G.U.1,3 1DIEI - Università di Perugia, via G.Duranti,93 - Italy 2IMM-CNR sez.di Bologna, via Gobetti 101 – Italy 3INFN sez. Perugia – via Pascoli, 10 – Italy In the framework of RD50-CERN Collaboration Workshop on p-type detectors
OUTLINE • development of the 3-level radiation damage model for n-type silicon • development of the 2-level radiation damage model for p-type silicon • simulation of Charge Collection Efficiency (CCE) in irradiated (n-type) silicon detectors
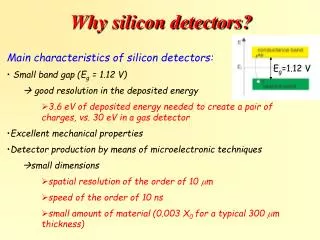
Simulation tool: • ISE-TCAD – discrete time and space solution of drift/diffusion and continuity equations • Damage modelling: - Deep levels: Et, n and p - SRH statistics - Uniform density of defect concentration Radiation damage Effects to simulate: • The increasing of the Leakage Current • The increasing of the Full Depletion Voltage • The decreasing of the Charge Collection Efficiency
Guard Ring Diode Guard Ring 6µm 9µm 15µm 40µm D Back Simulation setup Simulated device structure and parameters: Doping profiles: N and P doped substrates (71011 cm-3)6kΩcm. Charge concentration at the silicon-oxide interface of : 4 1011 cm-3 pre-irradiation 1 1012 cm-3 post-irradiation Optimized variable mesh definition Temperature = 300 K D (thickness) = 50-100-300 um
Guard Ring Diode Simulation setup • Variable mesh definition: • the mesh is better refined in correspondence of the critical points of the device to improve simulator performance. • - The typical electric field distribution at the depletion voltage of the diode.
The n-type (modified) 3-Level Radiation Damage Model* σn/p [cm-2]: cross section η [cm-1]: introduction rate * η=26 takes into account cluster defects * Angarano, Bilei, Giorgi, Ciampolini, Mihul, Militaru, Passeri, Scorzoni, CERN, Geneve, CMS CR 2000/006, 2000
The n-type (modified) 3-Level Radiation Damage Model* * η = 26 takes into account cluster defects * [Angarano, Bilei, Giorgi, Ciampolini, Mihul, Militaru, Passeri, Scorzoni, CERN, Geneve, CMS CR 2000/006, 2000]
The p-type One-Level Radiation Damage Model (*) [N. Zangenberg, et al.,Nuc. Instr. And Meth B 186 (2002) 71-77] [M. Ahmed, et al., Nuc. Instr. And Meth A 457 (2001) 588-594] ** 2 order of magnitude higher Measures extracted from [M. Lozano, et al., RD50 workshop, Firenze, Oct 2004]
The p-type One-Level Radiation Damage Model (*) [N. Zangenberg, et al.,Nuc. Instr. And Meth B 186 (2002) 71-77] [M. Ahmed, et al., Nuc. Instr. And Meth A 457 (2001) 588-594] Measures extracted from [M. Lozano, et al., RD50 workshop, Firenze, Oct 2004]
The p-type Two-Level Radiation Damage Model [(**) Levels selected from: M. Ahmed, et al., Nuc. Instr. And Meth A 457 (2001) 588-594 S.Pirolo et al., Nuc. Instr. And Meth. A 426 (1996) 126-130 ] * 1 order of magnitude higher *η Moll = 0.91.8 Measures extracted from [M. Lozano, et al., RD50 workshop, Firenze, Oct 2004]
The p-type Two-Level Radiation Damage Model [(**) Levels selected from: M. Ahmed, et al., Nuc. Instr. And Meth A 457 (2001) 588-594 S.Pirolo et al., Nuc. Instr. And Meth. A 426 (1996) 126-130 ] * 1 order of magnitude higher Measures extracted from [M. Lozano, et al., RD50 workshop, Firenze, Oct 2004]
The p-type Three-Level Radiation Damage Model: no improvement due to the donor defect level * 1 order of magnitude higher Measures extracted from [M. Lozano, et al., RD50 workshop, Firenze, Oct 2004]
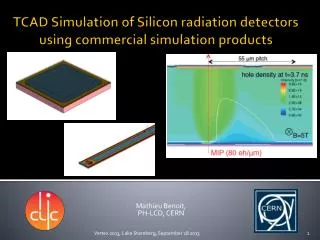
CCE Simulation MIP: 80 e-h pairs/ µm cylinder diameter = 2µm
CCE vs BIAS voltage for n-type silicon Simulation data well reproduce experimental* measure at the fluences of 1·1014 n/cm2 and 2.5·1014 n/cm2 * Measurements from Allport, Casse et al. NIMA 501 (2003) 146-152
CCE vs BIAS for n-type Simulation data at Fluence of 1·1015 n/cm2 and 1·1016 n/cm2 Problem: the diode collects charge also in the not depleted area. At a fluence of 5·1014: Simulated CCE = 75% Estimated (*) = 55% (*) [Bloch et al, NIMA 517 (2004) 121-127]
CCE vs BIAS for n-type Discussion about the ISE T-CAD Recombination Time model Default parameters of the Scharfetter model: NREF=1016 cm-3, γ=1, τmin=0, τmax(e) =3 µs, τmax(h) =10 µs change the NREFparameter in order to obtain the correct value of the recombinationtime (*) J.G.Fossum, D.S. Lee, Solid-State Electronics, vol.25,no.8 (1982). From RD50 status Report (2004): where
Scharfetter ISE T-CAD Recombination Time model Default parameters: NREF=1016 cm-3, γ=1, τmin=0, τmax(e) =3 µs, τmax(h) =10 µs Aim: modify/adapt the Scharfetter model to simulate the effect of deep-level defects on the reduction of carrier life-time (one pole in the TF)
Conclusions • Irradiated diodes have been analyzed considering a three levels simulation model for p-type and n-type Si substrates: • The two-level model for the p-type and the three-level for n-type fit experimental data for the Leakage Current and Full Depletion Voltage • The CiOi acceptor level for p-type silicon seems to be un-influential (at Room Temperature) • The three-level for n-type fits CCE experimental data only for fluences up to 2.5·1014 n/cm2. • Scharfetter recombination time empirical model can be eventually adapted to fit CCE experimental data at higher fluences (first good point @1e15 n/cm2).