Download
1 / 13
130 likes | 231 Vues
How Attitudes Affect Farmers’ Preferences for Biotechnology: the Case of Corn Growers in Brazil. Alexandre Gori Maia Institute of Economics - University of Campinas (UNICAMP) Email: gori@eco.unicamp.br Jose Maria Jardim da Silveira Institute of Economics – University of Campinas (UNICAMP)

E N D
How Attitudes Affect Farmers’ Preferences for Biotechnology: the Case of Corn Growers in Brazil Alexandre Gori Maia Institute of Economics - University of Campinas (UNICAMP) Email: gori@eco.unicamp.br Jose Maria Jardim da Silveira Institute of Economics – University of Campinas (UNICAMP) Email: jmsilv52@gmail.com
Introduction • Aim: Analyze how attitudes affect farmers’ preferences for biotechnology: the case of corn growers in Brazil. • Material: • Primary Data: 300 questionnaires; • Methods: • Factor Analysis; • Conjoint Analysis – Rank Ordered Probit Model; 2/13
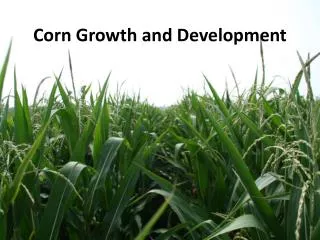
Corn Production in Brazil Background • Main Brazilian Producing Regions: Bahia, Goiás, Mato Grosso, Mato Grosso do Sul, Minas Gerais and Santa Catarina; GM Corn Area Total Corn Area 3/13
Factor Analysis Methods • Principal Component Factor : observable variables (Xi) can be decomposed in common factors (Fj) and unique factors (Ui): Factor 1 Factor 2 ... Factor m 4/13
Conjoint Analysis - Formats Methods Scenario A Scenario B Scenario C Scenario D Scenario C • Contingent Choice: weak information; • Contingent Rating: Strong assumptions; Scenario A Scenario B Scenario C Scenario D Rate 7 5 4 8 • Contingent Ranking: Complete order preference; Scenario C Scenario A Scenario B Scenario D Scenario A Scenario B Scenario C Scenario D Order 1 2 4 3 5/13
Conjoint Analysis - Scenarios Methods 6/13
Conjoint Analysis – Rank Ordered Probit Modelo Methods • Utility: the utility for alternative j of individual i : • Probability: if famer i choose alternative j in comparison with k: • Ordered Probit: Making some assumptions about the error term () : • Model: the expected utility can be modeled as: Characteristics of individuals Characteristics of alternatives 7/13
Attitudes Results • Questions related to different themes (environment, trust, risk perception, knowledge); • Farmers see positively scientific research and agriculture, as well they see negatively the use of pesticides; • Skepticism in relation to the impact of agriculture on environment; • They trust more in public than private agricultural agencies; • High knowledge about types of GM corn; • Climate instability and the rise of pests are the main factors of risk; 8/13
Factor Analysis Results Factors Loadings • 5 common factors (Fi), which explained 53% of the total variability; • Factor 1 (17%): Unfamiliarity with GM seeds and mistrust in agricultural agencies; • Factor 2 (12%): Environmental skepticism; • Factor 3 (9%): Lack of risk perception; • Factor 4 (8%): Mistrust in scientific research; • Factor 5 (7%): Lack of risk of pests and weed; 9/13
Revelead Preferences Results • Unfamiliarity with GM seeds and mistrust in agricultural agencies (Factor 1) is higher among non-GM farmers; • Bt farmers show higher degree of environmental skepticism (Factor 2); • Risk perception is higher among GM farmers (Factor 3); • Trust in scientific research is greater among Bt farmers and lower among RH farmers (Factor 4); • No evident of association for pests and weeds (Factor 5); 10/13
Stated Preferences Results • Characteristics of the alternatives (zj): Lower (1 for price lower than average) and Higher (1 for price higher than average); • Ordered Probit Model: • Characteristics of the individuals (xj): • Area: area in hectares; • D_Bt(1 for Bt farmer), D_RH (1 for RH farmer), D_Hybrid(1 for hybrid farmer) and D_Variety(1 for variety farmer); • Factor1 – Factor5: scores for the 5 common factors; • Two models: • Unrestricted: whole set of variables; • Restricted: without dummy variables for type of farmer; 11/13
Stated Preferences Results • Area: producers with larger areas are more likely to adopt Bt corn; • Price: no evidences that prices affect stated preferences; • Type of farmer: farmers cultivating GM seed are less likely to adopt non-GM seeds; • Trust in scientific research: the trust in scientific research is positively related to the propensity to adopt GM seeds; • Knowledge: the lower the knowledge with GM seed, the lower the propensity to adopt Bt seed; • Environmental attitudes: the higher the environmental skepticism, the higher the propensity to adopt Bt seeds; 12/13
Finals Considerations • Characteristics: farmers see positively the role of scientific research on agriculture and they are more skeptical in relation to the impacts of agriculture on the environment; • Revealed preferences: GM growers have higher trust in agricultural agencies and in scientific research. On the other hand, they are more environmentally skeptic; • Stated preferences: the propensity to adopt GM seed (specially Bt) are positively affect by area, trust in scientific research, knowledge about GM seeds and environmental skepticism. Moreover, farmers tend to be averse to changes; Thanks! 13/13