Efficiency and Exchange
Learn about market equilibrium and efficiency, and how price adjustments affect economic surplus. Discover the impact of price controls on housing markets and alternative solutions to help the poor.

Efficiency and Exchange
E N D
Presentation Transcript
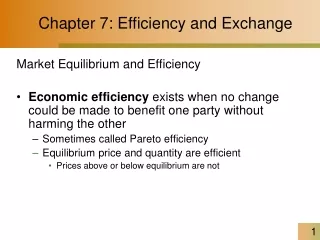
Market Equilibrium and Efficiency • A market equilibrium is efficient… • …if price and quantity take any other than their equilibrium values, a transaction that will make at least some people better off without harming others can always be found.
S D A Market in Which Price Is Below the Equilibrium Level 2.50 2.00 1.50 Price ($/gallon) 1.00 .50 1 2 3 4 5 Quantity (1,000s of gallons/day)
S 2.50 • If P = $1 then QS = 2,000 gallons/day • At 2,000 gallons the consumer is willing to pay $2 and the MC = $1 • If the buyer pays $1.25 for an extra gallon, producer is $.25 better off, and the consumer is $.75 better off, or economic surplus increases by $1.00 • At $1, the market is not efficient 2.00 1.50 Price ($/gallon) 1.25 1.00 .50 D 1 2 3 4 5 Quantity (1,000s of gallons/day) How Excess Demand Creates an Opportunity for a Surplus-Enhancing Transaction
S 2.50 • If P = $2 then QD = 2,000 gallons/day • Additional output costs only $1 • This is $1 less than a buyer would pay • If the buyer pays the seller $1.75, the buyer gains an economic surplus of $0.25 then the seller gains an economic surplus of $0.75 2.00 1.75 1.50 Price ($/gallon) 1.00 .50 D 1 2 3 4 5 Quantity (1,000s of gallons/day) How Excess Supply Creates an Opportunity for a Surplus-Enhancing Transaction
Market Equilibrium and Efficiency • When price is above or below the equilibrium, the quantity exchanged will be below the equilibrium. • The vertical value on the demand curve (marginal benefit) is greater than the vertical value on the supply curve (MC). • Only the equilibrium will maximize economic surplus.
Cash on the Table • When any “frictions” (typically government regulation) prevents the market price from reaching its equilibrium level, the total economic surplus (economic benefits less opportunity costs) available for buyers and sellers is diminished. • Mutually beneficial exchanges are always possible when a market is out of equilibrium. • When people have failed to take advantage of all mutually beneficial exchanges, there is "cash on the table.”
Social optimality • The socially optimal quantity of any good is the quantity that maximizes the total economic surplus that results from producing and consuming the good. • Cost-benefit principle • keep expanding production of the good as long as its marginal benefit is at least as great as its marginal cost. • Socially optimal quantity is that level for which the marginal cost and marginal benefit of the good are the same.
The Cost of PreventingPrice Adjustments • Price Ceilings: Do They Help the Poor? • A Price Ceiling for Housing Space • Also known as rent control
Consumer surplus = $900/day S Producer surplus = $900/day D Economic Surplus in an Unregulated Market for Housing Space 2.00 1.80 1.60 1.40 1.20 1.00 • Without price controls: • Equilibrium Price = $1.40 • Consumer surplus = (1/2)(3,000)(.60) = $900/day • Producer surplus = (1/2)(3,000)(.6) = 900/day • Economic surplus = $1,800/day Price ($) .80 1 2 3 4 5 8 Quantity of Housing /day
Consumer surplus = $900/day Lost economic surplus = $800/day Producer surplus = $100/day The Waste Caused by Price Controls Price Ceiling set at $1.00 S 2.00 1.80 1.60 1.40 1.20 1.00 D Price ($) .80 • With price controls: • Producer surplus = (1/2)(1,000)(.20) = $100/day or a loss of $800/day • Economic surplus = $1,000 or a loss of $800/day 1 2 3 4 5 8 Quantity of Housing /day
The Cost of PreventingPrice Adjustments • The reduction in economic surplus from a price ceiling will be underestimated when • The consumers who receive the product are not the consumers who value it the most. • Consumers take costly actions to enhance their chances of being served. • Non-price competition
Non-price Competition • If sub-lease is allowed, existing tenants may sub-lease part of their spaces to those tenants that are willing to pay more than the price ceiling. • If sub-lease is not allowed, shortage and non-price competition will develop. • Discrimination based on non-money considerations such as race, gender, marital status, pet ownership, and personalities • Dissipation of rent
Rent Control in the Long Run • If costs of maintaining and producing housing has increased, esp. during high inflation situation • Quality of housing deteriorates • Reduce excess demand or “shortage” • Amount supplied would decrease in time as residential space (under rent control) will be converted to other uses, e.g., office space • E.g. Housing in New York City and Los Angeles
The Cost of PreventingPrice Adjustments • Question • What program could be used to help the poor get housing spaces that would be more efficient than a price ceiling?
Surplus with price controls Surplus with income transfers and no price controls R R P P With price controls set at $1.00 the economic surplus is $1,000/day *R = economic surplus received by rich people *P = economic surplus received by poor people Without price controls & with income transfers economic surplus is $1,800/day *R & P have the same share and a much larger economic surplus When the Pie Is Larger, Everyone Can Have a Bigger Slice
The Cost of PreventingPrice Adjustments • Question • What would be a potential cost of income transfers?
The Cost of PreventingPrice Adjustments • Price Subsidies: Do They Help the Poor? • By how much do subsidies reduce total economic surplus in the market for bread? • Assume a small nation imports all its bread at the world price of $2.00
Economic surplus maximized where MC($2) = MB($2) at 4 million loaves Consumer surplus = $4,000,000/month S 2.00 World price = $ D Economic Surplus in a Bread Market Without Subsidy 5.00 Price of bread ($/loaf) 4.00 3.00 1.00 2 4 6 8 Quantity (millions of loaves/month)
The Reduction in EconomicSurplus from a Subsidy • Assume a $1/loaf subsidy • Consumers buy 6 million loaves • Consumer surplus will increase to $9 million • Economic surplus will fall by $1 million
Consumer surplus = $4,000,000/month Reduction in total economic surplus = $1,000,000/month S Domestic price with subsidy D The Reduction in EconomicSurplus from a Subsidy • The cost of the subsidy = $6 million/month • The benefit of the subsidy = $5 million/month • Loss of economic surplus = $1 million /month 5.00 4.00 Price of bread ($/loaf) 3.00 2.00 World price = $ 1.00 2 4 6 8 Quantity (millions of loaves/month)
The Cost of PreventingPrice Adjustments • Price Subsidies • How could we provide assistance to low income consumers more efficiently?
The Cost of PreventingPrice Adjustments • Economic Naturalist • First-Come, First-Served Policies • Why does no one complain any longer about being bumped from an overbooked flight?
Demand for remaining on the flight Supply of seats 60 24 33 37 Equilibrium in the Market for Seats on Oversold Flights Price ($/seat) Seats
First-come, First-served • Average reservation prices = (60+59+…+24)/37 = $42/passenger • 4 bumped @ $42 each or $168 loss in economic surplus Supply of seats 60 27 Price ($/seat) 24 33 37 Seats Equilibrium in the Market for Seats on Oversold Flights
Equilibrium in the Market for Seats on Oversold Flights • Compensation Policy • $27 = reservation price (compensation) to get 4 passengers to volunteer to stay • The cost of the compensation = 4 x $27 = $108 minus the economic surplus to the passengers of $6 = $102 Supply of seats 60 27 Price ($/seat) 24 33 37 Seats
The Cost of PreventingPrice Adjustments • Example • How should a tennis pro handle an overbooking problem?
Player Arrival time Reservation price Ann 9:50 A.M. $4 Bill 9:52 A.M. 3 Carrie 9:55 A.M. 6 Dana 9:56 A.M. 10 Earl 9:59 A.M. 2 The Cost of PreventingPrice Adjustments • 5 bookings for 3 slots • All 5 show up for the lesson • How can the tennis pro minimize the cost of rescheduling two students? • HINT: First-come, First-served or compensation
The Cost of PreventingPrice Adjustments • What do you think? • Why offer compensation when the cost of first-come, first-served to the seller is zero?
The Marginal Cost Pricing of Public Services • Example • How much should a city charge for water, electricity, or some other service?
Ocean 4.0 Lake Spring 0.8 0.2 1 3 The Marginal Cost Curve for Water • Three sources of water • Spring: 1 million gallons/day @ 0.2 cents/gallon • Lake: 2 million gallons/day @ 0.8 cents/gallon • Ocean: 4 cents/gallon Cost (cents/gallon) Water supplied (millions of gallons/day)
The Marginal Cost Curve for Water • Example • How much should a city charge for water?
Ocean 4.0 Lake Spring 0.8 0.2 1 3 The Marginal Cost Curve for Water • Assume • If P = 4 cents/gallon, Q = 4 million gallons • Question • Why should all residents pay 4 cents per gallon Cost (cents/gallon) Water supplied (millions of gallons/day)
Taxes and Subsidies • Effect of a sales tax on price and quantity • Imposition of a sales tax on goods lower their sales but increase their prices (in most cases). • Does it matter whether the tax is imposed on consumer or producers? • Economic incidence of a tax is independent of its legal incidence
Taxes and Subsidies • Who bears the burden of the tax? Consumers or producers • Depends on the relative elasticity of demand and supply • Effect of Subsidies (negative taxes) • Opposite effect to sales tax • Taxes and Efficiency
Without a tax P = $3/lb and Q = 3 million lbs/month S + tax S • With a tax of $1/lb • MC increases by $1/lb • Supply shifts up by $1 • P = $3.50; Q = 2.5 million • Consumers and producers share the burden of the tax equally • Producers receive $2.50/lb • Consumers pay $3.50/lb 3.50 3 2.50 D 2.5 The Effect of a Tax on the Equilibrium Quantity and Price of Avocados 6 5 4 Price ($/pound) 2 1 1 2 3 4 5 Quantity (millions of pounds/month)
$t / unit P P2 S a P0 b P1 t D D’ Q1 Q0 Q Government levies taxes on consumers: upward slopping supply P1 – Net Price received by seller P2 – Gross Price received by the buyers (P0 +a) t = a + b a – borne by consumer b – borne by producer
Government levies taxes on sellers: upward slopping supply $t / unit P2 – Gross price received by seller P1 – Net price received by the seller a – borne by consumer b – borne by producer P S’ P2 S a P0 b P1 D Q1 Q0 Q
Government levies taxes on sellers: vertical supply $t / unit P0 – Price before/after the new tax P1 – Net price received by the seller after the new tax P S P0 Consumers bear no burden Producers bear full burden t P1 D Q0 Q
$t / unit P S P0 t P1 D t D’ Q0 Q Government levies taxes on consumers: vertical supply P0 – Price received by the seller prior to the new tax P1 – Price received by the seller after the new tax P0-P1 = t Consumers bear no burden Producers bear full burden
S + $100 $20,100 S $20,000 • Supply shifts to $20,100 • The burden of the tax falls entirely on the consumer D 1.9 2.0 The Effect of a Tax on Sellers of a Good with Infinite Price Elasticity of Supply Assume a tax levy of $100 tax/car Price ($/car) Quantity (millions of cars/month)
Taxes and Efficiency • Who Pays a Tax? • When supply is perfectly elastic, the tax burden will fall entirely on the consumer.
In a Nutshell • Economic incidence of a tax is independent of its legal incidence • It does not matter whether the government imposes the tax on the sellers or the buyers, the ultimate burden of the tax depends on the relative elasticity of demand and supply. • In the case of an infinite inelastic supply curve (e.g., lands and human capital) , sellers bear the full burden of the tax, while consumers bear none. In contrast, consumers bear the full burden of the tax if the demand curve is perfectly inelastic.
Sales Tax on Food • If Hong Kong government proposes to levy a sale tax on rice? Who bears most of the tax burden? • Demand for food (relatively inelastic) and supply for food (relatively elastic). why?
Sales Tax on Food • The Japanese government protects her local farmers and imposes import restrictions on many agricultural produces, e.g., apple. If a sale tax on apple is imposed in Japan, who bears most of the tax burden? Why?
Mandatory Provident Fund (MPF) • Currently, employers contribute a half of the MPF (5%) and employees contribute another half of it (5%). • Who bears the burden of the MPF? Employers or employees? • If government shifts the MPF share from 50-50 sharing to 80-20 sharing (with employers contribute 80% of the MPF), does employees benefit from this new law?
Taxes and Quality of Goods • If government levies a tax (flat rate) by the bottle of wine, what is its effect on the sales of high-quality to low-quality wine? • Suppose Hong Kong government passes a law and subsidizes college students to buy computers. Each student gets $200 cash when the buy a computer, what is this law on the sales of high-end to low-end computers?
Taxes and Efficiency • Question • How will a tax on cars affect their prices in the long run?
Taxes and Efficiency • Deadweight Loss • The reduction in total economic surplus that results from the adoption of a policy
S + tax Deadweight loss caused by tax 3.50 2.50 2.5 The Deadweight Loss Caused by a Tax S 6 5 4 Price ($/pound) 3 2 1 D 1 2 3 4 5 Quantity (millions of pounds/month)