Exercise 8a: Georeferencing
Exercise 8a: Georeferencing. Prepare ArcMap display for georeferencing. Start ArcMap Start Using Arcmap with a new empty map Click OK Right Click on data frame Layers then click on Properties Click Coordinate System Tab Click Predefined Click Project Coordinate Systems

Exercise 8a: Georeferencing
E N D
Presentation Transcript
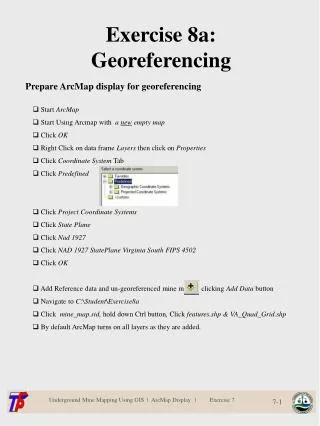
Exercise 8a: Georeferencing Prepare ArcMap display for georeferencing • Start ArcMap • Start Using Arcmap with a new empty map • Click OK • Right Click on data frame Layers then click on Properties • Click Coordinate System Tab • Click Predefined • Click Project Coordinate Systems • Click State Plane • Click Nad 1927 • Click NAD 1927 StatePlane Virginia South FIPS 4502 • Click OK • Add Reference data and un-georeferenced mine map by clicking Add Data button • Navigate to C:\Student\Exercise8a • Click mine_map.sid, hold downCtrl button, Click features.shp & VA_Quad_Grid.shp • By default ArcMap turns on all layers as they are added. Underground Mine Mapping Using GIS | ArcMap Display | Exercise 7
Analyze mine map image for features to use as links to reference data • In this exercise: use features that correspond to a typical 7.5 minute Quadrangle • Data view will be set to the extent of the datasets added • Right Click on the Mine_Map.sid layer • Click Zoom to Layer • Use navigation tools to look for features *insert picture* • Feature: Stream with intersection, Josh Branch • Use feature to search for reference location • Click Nad 1927 • Click NAD 1927 StatePlane Virginia South FIPS 4502 • Click OK • Add Reference data by clicking Add Data button • Navigate to C:\Student\Exercise8a • Click Nora_Duty_Quads_raster.lyr, features.shp & VA_Quad_Grid.shp • By default ArcMap turns on all layers as they are added. Underground Mine Mapping Using GIS | ArcMap Display | Exercise 7
Accessing other ArcGIS Tools • The ArcGIS suite of tools can be accessed directly from the ArcMap display via the Standard toolbar. This toolbar contains buttons to launch ArcCatalog, show the ArcToolBox window and activate the Command Line window. • On the Standard toolbar Click the ArcCatalog button ArcCatalog will launch in another window - *ArcToolBox & the Command Line appear as “dockable” windows with the ArcMap display • Close ArcCatalog • On the Standard toolbar Click the Show/Hide ArcToolbox Window button ArcToolbox contains multiple geoprocessing tools as well as additional extension processing tools - * Please see ArcGIS Desktop Help for detailed information • Close ArcToolbox • On the Standard toolbar Click the Show/Hide the Command Line Window button The Command Line Window allows users to execute geoprocessing or any function in ArcToolbox by entering commands • Close Command Line Window Windows activated within the ArcMap Display Underground Mine Mapping Using GIS | ArcMap Display | Exercise 7
Adding and managing data in the ArcMap display • Click on the Add Data button Navigate to the data directory and add XXXXX XXXXX XXXXX • The layers will appear in the table of contents and in the data view • Left-click on the top tif file • While hold down the Ctrl key select the bottom tif file – this should hi-lite all seven files • Click the Add button • Click OK for the warning message – You get this message because even though the tif files have been georeference, no information on project was added to the headers for each files. Your window should now look like the graphic below: • Next you will load some monitoring wells, washes, and a drainage basin. • Click on the Add Data icon and browse to C:\Student\Exercise9\XYZmine.mdb • Hold down on the Cntl key and select Local_Wash, LowerCO_RiverBasin, and Stream_Monitoring_station • Click Add to add these layer to the layout Underground Mine Mapping Using GIS | ArcMap Display | Exercise 7
Your window should look like the graphic below: • The watershed basin layer is covering up most of the other data – let’s fix this • Right-click on LowerCO_RiverBasin and select Properties • In the Layer Properties window select the Symbology tab • Click on the tab that is showing the default color (your color may be different) of the basin polygon This will bring up the Symbol Selector window • For Fill Color use the dropdown and select No Color • Set the Outline Width to 1.5 • Set the Outline Color to a dark blue color Underground Mine Mapping Using GIS | ArcMap Display | Exercise 7
Your window should look like the graphic below: • Click OK to close the Symbol Selector window • Click OK again to apply you changes and close the Layer Properties window You will now do the same type of operation to change the permit boundary • Right-click on PermitmineXYZ and select Properties • Click on the tab that is showing the default color (your color may be different) of the permit polygon This will bring up the Symbol Selector window • For Fill Color use the dropdown and select No Color • Set the Outline Width to 2 • Set the Outline Color to a bright red color • Click OK to close the Symbol Selector window • Click OK again to apply you changes and close the Layer Properties window Underground Mine Mapping Using GIS | ArcMap Display | Exercise 7
Your window should resemble the graphic below: • The stream monitoring stations are too small to stand out – you will now change the symbol to a different style, color and size, but first we will save our map. • Click on the File and select Save As • In the Save As window browse to C:\Student\Exercise9 and save the map as mapex9.mxd Note Underground Mine Mapping Using GIS | ArcMap Display | Exercise 7
Click Save to save the map file and exit the Save As window Changing the symbology for the monitoring stations • Right-click on Stream_Monitoring_station and select Properties • Click on the Symbol icon – this will bring up the Symbol Selector window • Move the slider down until you locate Pentagon 3 symbol • Select the Pentagon 3 symbol and change the color to bright yellow • Keep the default size of 18.00 • Click OK to close the Symbol Selector window • Click OK again to apply you changes and close the Layer Properties window Next we will resize the map • Click on the layout to select the data frame – it will light up with a light blue line with blue squares on the corner and midpoint of the data frame • Click on the blue squares and stretch out (enlarge) the data frame so that your window resembles the graphic below – remember to stay inside of the light gray dashed lines (margin lines) Underground Mine Mapping Using GIS | ArcMap Display | Exercise 7
You will now turn on the labels for the monitoring station • Right-click on the Stream_Monitoring_station layer and select Properties • Click on the Labels tab • Click on Label all the features the same way • For the Label Field: make sure ID is selected • Click OK to apply the changes and exit the Layer Properties window • Zoom in on the stream monitoring stations by using the Zoom In tool click on the icon (note that the mouse pointer changes) and then click on the upper left hand corner of the area of interest and drag a box around the area to zoom into. Your results should look something like the graphics below: • As you can see the monitoring stations are now labeled with the data found in the ID field • To zoom back to the full extent of the map click on the Zoom Whole Page icon Underground Mine Mapping Using GIS | ArcMap Display | Exercise 7
Step 3: Adding Map Elements • Map elements • Map body—the primary mapped area. You can display more than one image of your primary mapped area within your document. For example, you may want to portray change by showing several images with differing but related information, such as population maps of various years. Your map may also contain a locator map (a smaller-scale map used to help the reader in understanding where the main area of interest is located), an inset map (used to give more detailed information of an area within the main map that may not easily be understood), or an index map (often used to show where in a series of maps one map exists). All are used to assist in communicating your information to others. In ArcMap, each of these mapped areas is referred to as a data frame. • Title—used to tell the reader what the map represents. This is often placed on a map layout as text. • Legend—lists the symbology used within the map and what it represents. This can be created using the Legend Wizard in the layout and edited further once created. • Scale—provides readers with the information they need to determine distance. A map scale is a ratio, where one unit on the map represents some multiple of that value in the real world. It can be numeric (1:10,000), graphic (a scale bar), or verbal (one inch equals 10,000 inches). Maps are often referred to as “large” or “small” scale. This “size” reference refers to the ratio (or fraction). For example, a 1:100 scale map is larger than a 1:10,000 map, because 1/100 (0.01) is a larger value than 1/10,000 (0.00001). A smaller scale map displays a larger area, but with less detail. The scale is inserted in the map layout view. • Projection—a mathematical formula that transforms feature locations from the earth's curved surface to a map's flat surface. Projections can cause distortions in distance, area, shape, and direction; no projection can avoid some distortion. Therefore, the projection type is often placed on the map to help readers determine the accuracy of the measurement information they get from the map. • Direction—is shown using a North arrow. A map may show true north and magnetic north. This element is inserted in the map layout view. • Data source—the bibliographic information for the data used to develop the map. • Other map components include (but are not limited to) dates, pictures, graticules or grids, reports, tables, additional text, neatlines, and authorship. Underground Mine Mapping Using GIS | ArcMap Display | Exercise 7
For your map you will be adding north arrow, scale bar, scale text, legend and a title. • Click on the Insert drop down and select Legend… this will bring up the Legend Wizard • Do not include the Quad layer in the legend • Remove all of the tif items listed under Legend Items column by selecting them and then clicking on the icon to move them back to the Map Layers: column • Click Next • Take the defaults for the next window – click Next • Use the drop-down from the Border menu and select 2.0 Point • For a Background color select Grey 10% • For a Drop Shadow color select Grey 30% • Click Next • For Legend Items make sure that PermitmineXYZ is selected • Click on the Area: drop-downand select the Urbanized Area shape • Click Next • Take the defaults for the spacing window and click Finish Underground Mine Mapping Using GIS | ArcMap Display | Exercise 7
The legend will appear in the center of your layout. Click and resize/move it so that your map looks similar to the one below: • Save your layout changes – Click on File > Save this will update your mapex9.mxd file • To insert a north arrow – Click on Insert > North Arrow… • In the North Arrow Selector window select the ESRI North 7 style • Click on OK • The north arrow will appear in the center of your layout. Click and resize/move it so that your map looks similar to the one below: Underground Mine Mapping Using GIS | ArcMap Display | Exercise 7
To insert a title for the map – click Insert > Title - this inserts a textbox with the default name that is the same as your .mxd file name (in your case mapex9) • Type in the text for the title - for your map type MineXYZ Stream Monitoring Stations • Move the title to a location on top of the map • Right-click on the title and select Properties • In the Properties window select Change Symbol… • Under Options Color: select a medium blue color • For Size: select 28 and turn on the bold option by depressing the B icon • Click OK twice to dismiss the windows and apply your changes Underground Mine Mapping Using GIS | ArcMap Display | Exercise 7
Click and resize/move your title so that your map looks similar to the one below: • To add a scale bar – click on Insert > Scale Bar… • In the Scale Bar Selector window select the Alternating Scale Bar 1 style • Click OK • Click and drag the scale bar to a position on the bottom center of your layout • Right-click on the scale bar and select Properties • Click on the Scale and Units tab • Set Number of divisions: to 4 • Set Number of Subdivisions to 2 • Click on Show one division before zero • For When resizing… select Adjust Number of Divisions • For Label Position: select below bar • For Division Value: type in 12000 Underground Mine Mapping Using GIS | ArcMap Display | Exercise 7
Your window should now look like the graphic below: • Click OK • You may have to resize the scale bar so that it looks like to the graphic below: Underground Mine Mapping Using GIS | ArcMap Display | Exercise 7
Save your map – File > Save Step 4: Printing/Exporting your map • After you have finished developing your map and have save it to a .mxd file your next option is to either export your map to a raster format for use in another software package such as Microsoft Word or print the map to an output device. • First you will print your map – it is always a good idea to preview the map before sending it to the printer. • Click on File > Print Preview • If everything looks OK the click on the Print tab – this will bring up the Print window • Click on the drop-down for Printer Engine: and select ArcPress Printer (note: not all output devices will allow you to use ArcPress, in that case you will have to stay with either the Windows Printer or PostScript Printer engines). • Click on the Properties… tab to bring up the ArcPress Printer window • In this window we can change such things as Resolution, Gamma, Brightness etc. – click on the General tab and set the Resolution to 300 • Click OK • Click OK again to send you map to the printer Now let’s try and export our map for use in a Word document. • Click on File > Export Map… • For Save in: browse to C:\Student\Exercise9 • For File name: type inmap9 • For Save as type: select JPEG(*.jpg) • Make sure the General tab is selected and set Resolution: to 150 • Click the Save tab to apply the export and close the window • Exit ArcMap Underground Mine Mapping Using GIS | ArcMap Display | Exercise 7
Challenge – Try to bring the file that you just exported into Microsoft Word End of Exercise 9 Underground Mine Mapping Using GIS | ArcMap Display | Exercise 7
xx Underground Mine Mapping Using GIS | ArcMap Display | Exercise 7