GIS in Water Resources Midterm Review 2011
850 likes | 1.01k Vues
GIS in Water Resources Midterm Review 2011. David Maidment, David Tarboton and Ayse Irmak. Readings. Georeferencing and Coordinate Systems (Level 3) http://help.arcgis.com/en/arcgisdesktop/10.0/help/index.html#//00v20000000q000000.htm

GIS in Water Resources Midterm Review 2011
E N D
Presentation Transcript
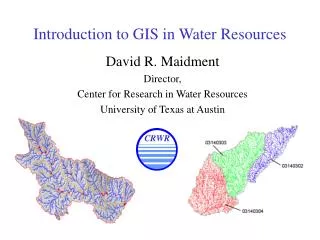
GIS in Water ResourcesMidterm Review 2011 David Maidment, David Tarboton and Ayse Irmak
Readings • Georeferencingand Coordinate Systems (Level 3) http://help.arcgis.com/en/arcgisdesktop/10.0/help/index.html#//00v20000000q000000.htm • Map Projections (Level 4)http://help.arcgis.com/en/arcgisdesktop/10.0/help/index.html#/What_are_map_projections/003r00000001000000/ ) • Geographic information Elements: (Level 2)http://help.arcgis.com/en/arcgisdesktop/10.0/help/00v2/00v200000003000000.htm up to "Example: Representing surfaces" • Raster Data (Level 3)http://help.arcgis.com/en/arcgisdesktop/10.0/help/009t/009t00000002000000.htm Raster and Images, starting from "What is raster data" to end of "Raster dataset attribute tables" in "Fundamentals of raster data" • Slope http://www.ce.utexas.edu/prof/maidment/giswr2011/docs/Slope.pdf. (Level 4) • Hydrology tools (Level 5) http://help.arcgis.com/en/arcgisdesktop/10.0/help/009z/009z0000004w000000.htm to end of Hydrologic analysis sample applications in the Hydrology toolset concepts • Geometric Networks (Level 2) http://help.arcgis.com/en/arcgisdesktop/10.0/help/index.html#/What_are_geometric_networks/002r00000001000000/ • Linear Referencing (Level 2) http://help.arcgis.com/en/arcgisdesktop/10.0/help/index.html#/What_is_linear_referencing/003900000001000000/
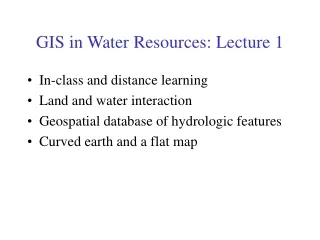
Review for Midterm Exam • Location on the Earth • ArcGIS as a Geographic Information System • Working with Raster Data • Working with Vector Data
Review for Midterm Exam • Location on the Earth • ArcGIS as a Geographic Information System • Working with Raster Data • Working with Vector Data Georeferencing and Coordinate Systems (Level 3) http://help.arcgis.com/en/arcgisdesktop/10.0/help/index.html#//00v20000000q000000.htm Map Projections (Level 4)http://help.arcgis.com/en/arcgisdesktop/10.0/help/index.html#/What_are_map_projections/003r00000001000000/ )
Latitude and Longitude on a Spherical Earth Longitude line (Meridian) N W E S Range: 180ºW - 0º - 180ºE Latitude line (Parallel) N W E S (0ºN, 0ºE) Equator, Prime Meridian Range: 90ºS - 0º - 90ºN
Origin of Geographic Coordinates Equator (0,0) Prime Meridian
Length on Meridians and Parallels (Spherical Earth) (Lat, Long) = (f, l) Length on a Meridian: AB = ReDf (same for all latitudes) R Dl D R 30 N C B Re Df 0 N Re Length on a Parallel: CD = R Dl = ReDl Cos f (varies with latitude) A
Example: What is the length of a 1º increment along • on a meridian and on a parallel at 30N, 90W? • Radius of the earth = 6370 km. • Solution: • A 1º angle has first to be converted to radians • p radians = 180 º, so 1º = p/180 = 3.1416/180 = 0.0175 radians • For the meridian, DL = ReDf = 6370 * 0.0175 = 111 km • For the parallel, DL = ReDl Cos f • = 6370 * 0.0175 * Cos 30 • = 96.5 km • Parallels converge as poles are approached
Z B A • Y X Curved Earth Distance on a Spherical Earth Shortest distance is along a “Great Circle” (from A to B) A “Great Circle” is the intersection of a sphere with a plane going through its center. 3. Great circle distance is R, where R=6378.137 km2 Ref: Meyer, T.H. (2010), Introduction to Geometrical and Physical Geodesy, ESRI Press, Redlands, CA, p. 108
Shape of the Earth It is actually a spheroid, slightly larger in radius at the equator than at the poles We think of the earth as a sphere
Ellipse An ellipse is defined by: Focal length = Distance (F1, P, F2) is constant for all points on ellipse When = 0, ellipse = circle Z b O a X F1 F2 For the earth: Major axis, a = 6378 km Minor axis, b = 6357 km Flattening ratio, f = (a-b)/a ~ 1/300 P
Ellipsoid or SpheroidRotate an ellipse around an axis Z b a O Y a X Rotational axis
Horizontal Earth Datums • An earth datum is defined by an ellipse and an axis of rotation • NAD27 (North American Datum of 1927) uses the Clarke (1866) ellipsoid on a non geocentric axis of rotation • NAD83 (NAD,1983) uses the GRS80 ellipsoid on a geocentric axis of rotation • WGS84 (World Geodetic System of 1984) uses GRS80, almost the same as NAD83
Definition of Latitude, f m p S n O f q r (1) Take a point S on the surface of the ellipsoid and define there the tangent plane, mn (2) Define the line pq through S and normal to the tangent plane (3) Angle pqr which this line makes with the equatorial plane is the latitude f, of point S
P Prime Meridian Equator Meridian plane Cutting Plane of a Meridian
Definition of Longitude, l l = the angle between a cutting plane on the prime meridian and the cutting plane on the meridian through the point, P 180°E, W -150° 150° -120° 120° 90°W (-90 °) 90°E (+90 °) P -60° l -60° -30° 30° 0°E, W
Global Positioning Systems Distance to four satellites gives (x,y,z)
~ Sea surface Ellipsoid Earth surface Geoid Representations of the Earth Geoid is a surface of constant gravitational potential
Definition of Elevation Elevation Z P z = zp • Land Surface z = 0 Mean Sea level = Geoid Elevation is measured from the Geoid
Vertical Earth Datums • A vertical datum defines elevation, z • NGVD29 (National Geodetic Vertical Datum of 1929) • NAVD88 (North American Vertical Datum of 1988) • The National Elevation Dataset is in the NAVD88 datum • Heights are “elevation above datum”
Geodesy and Map Projections • Geodesy - the shape of the earth and definition of earth datums • Map Projection - the transformation of a curved earth to a flat map • Coordinate systems - (x,y) coordinate systems for map data
Representative Fraction Globe distanceEarth distance = Earth to Globe to Map Map Projection: Map Scale: Scale Factor Map distanceGlobe distance = (e.g. 1:24,000) (e.g. 0.9996)
Types of Projections • Conic (Albers Equal Area, Lambert Conformal Conic) - good for East-West land areas • Cylindrical (Transverse Mercator) - good for North-South land areas • Azimuthal (Lambert Azimuthal Equal Area) - good for global views
Projections Preserve Some Earth Properties • Area - correct earth surface area (Albers Equal Area) important for mass balances • Shape - local angles are shown correctly (Lambert Conformal Conic) • Direction - all directions are shown correctly relative to the center (Lambert Azimuthal Equal Area) • Distance - preserved along particular lines • Some projections preserve two properties
Coordinate Systems A planar coordinate system is defined by a pair of orthogonal (x,y) axes drawn through an origin Y X Origin (xo,yo) (fo,lo)
State Plane Coordinate System • Defined for each State in the United States • East-West States (e.g. Texas) use Lambert Conformal Conic, North-South States (e.g. California) use Transverse Mercator • Texas has five zones (North, North Central, Central, South Central, South) to give accurate representation • Greatest accuracy for local measurements
Review for Midterm Exam • Location on the Earth • ArcGIS as a Geographic Information System • Working with Raster Data • Working with Vector Data Geographic information Elements: (Level 2)http://help.arcgis.com/en/arcgisdesktop/10.0/help/00v2/00v200000003000000.htm up to "Example: Representing surfaces"
Data Model Conceptual Model – a set of concepts that describe a subject and allow reasoning about it Mathematical Model – a conceptual model expressed in symbols and equations Data Model – a conceptual model expressed in a data structure (e.g. ascii files, Excel tables, …..) Geographic Data Model – a conceptual model for describing and reasoning about the world expressed in a GIS database
Linking Geography and Attributes • GIS has a one to one association between a geographic feature and a record in an attribute table. Geographic coordinates Tabular attributes
Themes or Data Layers Vector data: point, line or polygon features How each of these features could be represented using vector or raster?
Common Geospatial Information Types Image: Michael Zeiler, ESRI
Raster and Vector Data Raster data are described by a cell grid, one value per cell Vector Raster Point Line Zone of cells Polygon
Geodatabase – a store for all types of geospatial information
Workspace Geodatabase Feature Dataset Feature Class Geometric Network Relationship Object Class ArcGIS Geodatabase (what is in a geodatabase)
Geodesy, Map Projections and Coordinate Systems • Geodesy - the shape of the earth and definition of earth datums • Map Projection - the transformation of a curved earth to a flat map • Coordinate systems - (x,y) coordinate systems for map data Spatial Reference = Datum + Projection + Coordinate system
Defined for a feature dataset in ArcCatalog XY Coordinate System Projected Geographic Z Coordinate system Tolerance Resolution M Domain ArcGIS Spatial Reference Frames
Geographic coordinates (decimal degrees) Projected coordinates (length units, ft or meters) Horizontal Coordinate Systems
Key ArcGIS Software Components • ArcMap • ArcCatalog • ArcToolbox • Extensions • Geoprocessing
Arc Catalog Graphical previews View data (like Windows Explorer) Tables Metadata
Arc Toolbox Tools for commonly used tasks Map Projections
Analysis of land surface terrain as a grid Key means of defining drainage areas and connectivity to stream network Spatial Analyst
Geo-Processing Toolbox tools linked together using the model builder to automate data processing
Web-centered GIS ArcGIS Online
An Integrated Systems Approach ArcGIS Online ArcGIS Server ArcGISDesktop
Review for Midterm Exam • Location on the Earth • ArcGIS as a Geographic Information System • Working with Raster Data • Working with Vector Data Raster Data (Level 3)http://help.arcgis.com/en/arcgisdesktop/10.0/help/009t/009t00000002000000.htm Raster and Images, starting from "What is raster data" to end of "Raster dataset attribute tables" in "Fundamentals of raster data" Slope http://www.ce.utexas.edu/prof/maidment/giswr2011/docs/Slope.pdf . (Level 4) Hydrology tools (Level 5) http://help.arcgis.com/en/arcgisdesktop/10.0/help/009z/009z0000004w000000.htm to end of Hydrologic analysis sample applications in the Hydrology toolset concepts
(x1,y1) y f(x,y) x Spatial Analysis Using Grids Two fundamental ways of representing geography are discrete objects and fields. The discrete object view represents the real world as objects with well defined boundaries in empty space. Points Lines Polygons The field view represents the real world as a finite number of variables, each one defined at each possible position. Continuous surface
Numerical representation of a spatial surface (field) Grid TIN Contour and flowline
Grid Datasets Number of columns Cell size Number of rows • Cellular-based data structure composed of square cells of equal size arranged in rows and columns. • The grid cell size and extent (number of rows and columns), as well as the value at each cell have to be stored as part of the grid definition.