Download
1 / 8
80 likes | 198 Vues
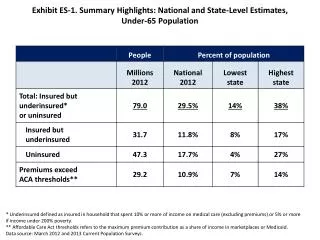
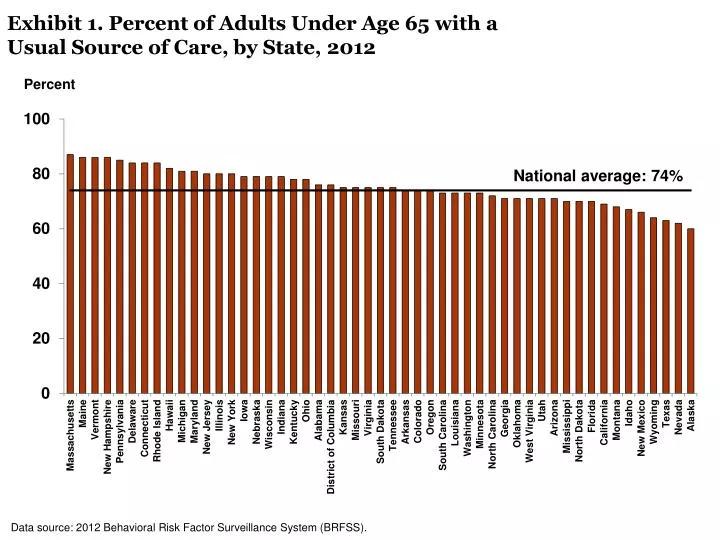
Exhibit 1. Percent of Adults Under Age 65 with a Usual Source of Care, by State, 2012. Percent. Data source: 2012 Behavioral Risk Factor Surveillance System (BRFSS ). Exhibit 2. Insured Adults More Likely to Have a Usual Source of Care, 2012.

E N D
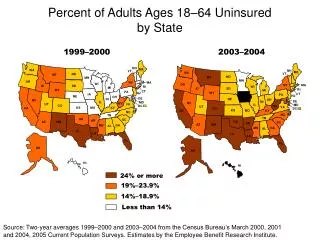
Exhibit 1. Percent of Adults Under Age 65 with a Usual Source of Care, by State, 2012 Percent Data source: 2012 Behavioral Risk Factor Surveillance System (BRFSS).
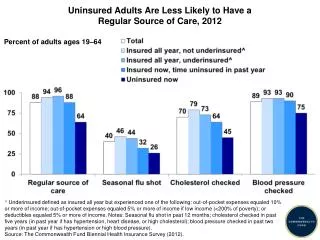
Exhibit 2. Insured Adults More Likely to Have a Usual Sourceof Care, 2012 Percent of adults under age 65 with a usual source of care Data source: 2012 Behavioral Risk Factor Surveillance System (BRFSS).
Exhibit 3. Percent of Adults Under Age 65 with a Usual Source of Care, by Income and Insurance, 2012 Percent Note: FPL = federal poverty level. Data source: 2012 Behavioral Risk Factor Surveillance System (BRFSS).
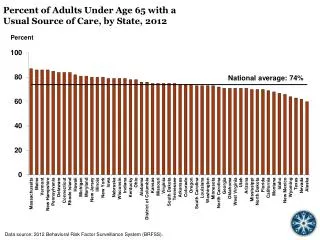
Exhibit 4. Percent of Older Adults Who Received Recommended Preventive Care, by State, 2012 Percent of adults ages 50 to 64 Note: Recommended care includes receipt of all of the following within a specific time frame given their age and sex: screenings for colon, breast, and cervical cancer, and flu shots. Data source: 2012 Behavioral Risk Factor Surveillance System (BRFSS).
Exhibit 5. Insured Older Adults More Likely to Receive Recommended Preventive Care, 2012 Percent of adults ages 50 to 64 receiving preventive care Note: Recommended care includes receipt of all of the following within a specific time frame given their age and sex: screenings for colon, breast, and cervical cancer, and flu shots. Data source: 2012 Behavioral Risk Factor Surveillance System (BRFSS).
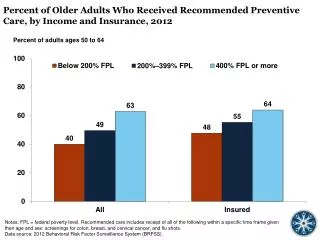
Exhibit 6. Percent of Older Adults Who Received Recommended Preventive Care, by Income and Insurance, 2012 Percent of adults ages 50 to 64 Notes: FPL = federal poverty level. Recommended care includes receipt of all of the following within a specific time frame given their age and sex: screenings for colon, breast, and cervical cancer, and flu shots. Data source: 2012 Behavioral Risk Factor Surveillance System (BRFSS).
Exhibit 7. Percent of Adults Under Age 65 Who Went Without Care Because of Cost, by Income and Insurance, 2012 Percent Note: FPL = federal poverty level. Data source: 2012 Behavioral Risk Factor Surveillance System (BRFSS).
Exhibit 8. Percent of Older Adults Who Received Recommended Preventive Care, by Insurance, 2012 All Adults Ages 50 to 64 Insured Adults Ages 50 to 64 Note: Recommended care includes receipt of all of the following within a specific time frame given their age and sex: screenings for colon, breast, and cervical cancer, and flu shots. Data source: 2012 Behavioral Risk Factor Surveillance System (BRFSS).