Download
1 / 13
130 likes | 195 Vues
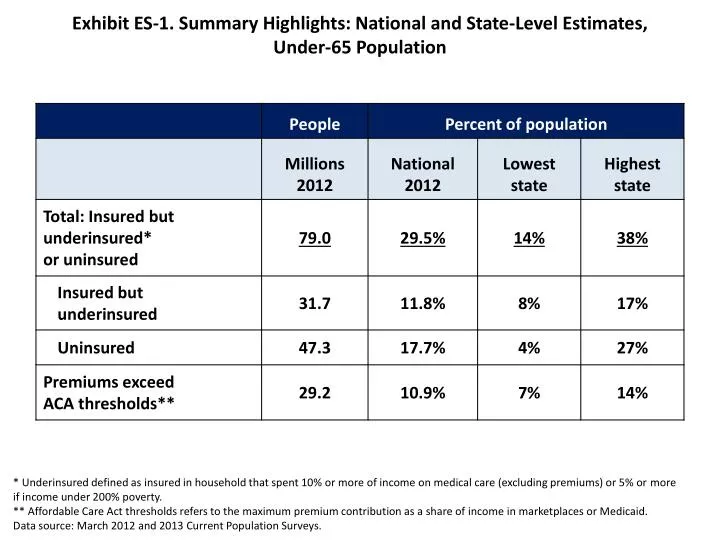
Exhibit ES-1. Summary Highlights: National and State-Level Estimates, Under-65 Population. * Underinsured defined as insured in household that spent 10% or more of income on medical care (excluding premiums) or 5% or more if income under 200% poverty.

E N D
Exhibit ES-1. Summary Highlights: National and State-Level Estimates, Under-65 Population * Underinsured defined as insured in household that spent 10% or more of income on medical care (excluding premiums) or 5% or more if income under 200% poverty. ** Affordable Care Act thresholds refers to the maximum premium contribution as a share of income in marketplaces or Medicaid. Data source: March 2012 and 2013 Current Population Surveys.
Exhibit 1. Uninsured or Underinsured: National Trends, Under-65 Population * Underinsured defined as insured in household that spent 10% or more of income on medical care (excluding premiums) or 5% or more if income under 200% poverty.Data source: March 2011, 2012, and 2013 Current Population Surveys.
Exhibit 2. Distribution of Underinsured by Poverty, Under-65 Population, 2012 Insured but underinsured:* 31.7 million people 1.7 million5% 4.2 million13% 16.0 million50% 9.7 million31% Note: Sum of percentages or people may not equal total because of rounding. * Underinsured defined as insuredin household that spent 10% or more of income on medical care (excluding premiums) or 5% or more if income under 200% poverty.Data source: March 2013 Current Population Survey.
Exhibit 3. Underinsured by State, 2011–2012Ranges from 8 percent to 17 percent of population Percent of under-65 population Note: Underinsured defined as insuredin household that spent 10% or more of income on medical care (excluding premiums) or 5% or more if income under 200% poverty.Data source: March 2012–2013 Current Population Survey (states: two-year average).
Exhibit 4. Underinsured or Uninsured by State, 2011–2012Ranges from 14 percent to 38 percent of population Percent of under-65 population National average (2012): 29% * Underinsured defined as insuredin household that spent 10% or more of income on medical care (excluding premiums) or 5% or more if income under 200% poverty.Data source: March 2012–2013 Current Population Survey (states: two-year average).
Exhibit 5. Distribution of Underinsured or Uninsured by Poverty, Under-65 Population, 2012 Insured but underinsured* or uninsured: 79 million people 6.8 million9% 15.6 million20% 33.3 million42% 23.2 million29% * Underinsured defined as insuredin household that spent 10% or more of income on medical care (excluding premiums) or 5% or more if income under 200% poverty.Data source: March 2013 Current Population Survey.
Exhibit 6. At Risk: 79 Million Uninsured or Underinsured, 2012 Percent of under-65 population 63 47 29 20 8 Notes: FPL = federal poverty level. Percentages may not sum to total because of rounding. * Underinsured defined as insuredin household that spent 10% or more of income on medical care (excluding premiums) or 5% or more if income under 200% poverty. Data source: March 2013 Current Population Survey.
Exhibit 7. Middle-Income Uninsured or Underinsured by State, 2011–2012 Percent of middle-income population under age 65 • Middle-income = 200%–399% of the federal poverty level. * Underinsured defined as insuredin household that spent 10% or more of income on medical care (excluding premiums) or 5% or more if income under 200% poverty.Data source: March 2012–2013 Current Population Survey (states: two-year average).
Exhibit 8. Total Premiums for Employer-Sponsored Insurance Rise Sharply as Share of Median Income for Under-65 Population, 2003 and 2012 2003 2012 Less than 17% 17%–19% 20%–22% 23%–28% Note: Premiums include employer and employee shares. Data sources: 2003, 2012 Medical Expenditure Panel Survey–Insurance Component; March 2004 and March 2013 Current Population Surveys for median income.
Exhibit 9. Premium Tax Credits and Cost-Sharing Protections Under the Affordable Care Act Note: FPL refers to federal poverty level as of 2013. Actuarial values are the average percent of medical costs covered by a health plan. Premium and cost-sharing credits are for silver plan. Out-of-pocket limits for 2014.Source: Commonwealth Fund Health Reform Resource Center: What’s in the Affordable Care Act? (PL 111-148 and 111-152), http://www.commonwealthfund.org/Health-Reform/Health-Reform-Resource.aspx.
Exhibit 10. Twenty-Nine Million Insured Paid Premiums in Excess of Affordable Care ActThresholds, 2011–2012 Percent of insured under age 65 who paid premiums that exceed ACA thresholds 8%–11% (8 states + D.C.) 12%–14% (27 states) 15%–17% (15 states) Note: Affordable Care Act thresholds refers to the maximum premium contribution as a share of income in marketplaces or Medicaid if eligible to participate. Data source: March 2012–2013 Current Population Survey (states: two-year average).
Exhibit 11. Distribution of Uninsured or Underinsured by Poverty, 2012 11% 5.1million 37% 17.4 million 13% 6.2 million 15% 7.3 million 24% 11.3 million 47.3 million uninsured under age 65 in 2012 5% 1.7mill-ion 50% 16.0 million 13% 4.1 million 18% 5.7 million 13% 4.2 million 31.7 million underinsured under age 65 in 2012 Notes: Percentages may not add to 100% because of rounding. Underinsured defined as insuredin household that spent 10% or more of income on medical care (excluding premiums) or 5% or more if income under 200% poverty.Data source: March 2013 Current Population Survey.
Exhibit 12. Status of State Participation in Medicaid Expansion, as of March 2014 NH WA VT ME ND MT AK MN OR NY WI MA ID SD MI RI WY PA CT NJ IA OH NE DE IN NV IL MD WV UT VA CO DC MO CA KS KY NC TN OK SC AR AZ NM GA HI AL MS TX LA FL Expanding (22 states + D.C.) Expanding with variation (4 states) Options under discussion (5 states) Not expanding (19 states) Note: The Centers for Medicare and Medicaid Services (CMS) has approved waivers for expansion with variation in Arkansas, Iowa, and Michigan. Pennsylvania’s waiver is currently under review by CMS. Source: AvalereState Reform Insights; Center of Budget and Policy Priorities; Politico.com; Commonwealth Fund analysis.