Download
1 / 51
510 likes | 541 Vues
Project Metrics. Infsy 570 Dr. R. Ocker. goal of metrics. to improve product quality and development-team productivity concerned with productivity and quality measures measures of SW development output as function of effort and time measures of usability. terms:. measure

E N D
Project Metrics Infsy 570 Dr. R. Ocker
goal of metrics • to improve product quality and development-team productivity • concerned with productivity and quality measures • measures of SW development output as function of effort and time • measures of usability
terms: • measure • quantitative expression of an attribute of a product or process • measurement • the act of determining a measure • metric • quantitative measure of the degree to which a system, component or process possesses an attribute
terms: • indicator • a metric that provides insight into the SW process or project • enables manager to adjust (improve) the process or project • process indicators • allow assessment of process in terms of what works and what doesn’t
Terms: • project indicators • allow manager to • (1) assess status of ongoing project • (2) track project risks • (3) uncover problem areas • (4) adjust tasks or workflow • (5) evaluate team’s ability to control quality
metrics apply to • process - used to develop the SW • project - specific SW development project • product - SW produced • many of the same metrics apply to both the process and project domains
1. Process metrics and SW process improvement • How to improve SW quality and organizational performance? • fig 4.1 text, fig.2 Paulish & Carleton: • Factors that influence quality: • people - skills and experience of SW people • technology - used in development (e.g. CASE) • product complexity • process - glue that ties it all together
motivation to improve process: • results from business need, e.g. strong competition, need increased profitability • “The only rational way to improve any process is to measure specific attributes of the process, develop a set of meaningful metrics based on these attributes, and then use the metrics to provide indicators that will lead to a strategy for improvement.” • ... process metrics are strategic
Process improvement approach (fig. 3, Paulish et al.) • business need • motivation to improve • assessment (of current practices and process maturity level) • improvement methods selected • metrics measure impact
Process improvement approach (fig. 3, Paulish et al.) • business establishes goals to improve process over period of time • defines measures to gauge progress • when data indicate process problems - take corrective action
Software process improvement method • integrated collection of procedures, tools, and training for increasing product quality, improving development-team productivity, or reducing development time
Some outcomes of an improved SW process might include: • fewer defects • earlier identification and correction of defects • faster time to market • better predictability of project schedules and resources
Types of process metrics: • private vs. public metrics • SW process improvement should begin at the individual level
some private metrics: • defect rates by individual • defect rates by module • errors found during development
public metrics • use information from individual and team metrics • some public metrics: • project-level defect rates • effort • calendar times
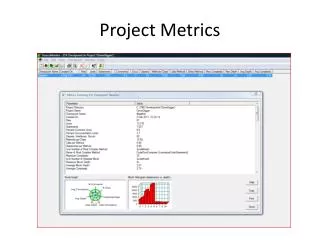
2. Project Metrics • project metrics are tactical • used by project manager to adapt project work flow and technical activities • i.e. guide adjustments to work schedule to avoid delays; assess product quality on an ongoing basis
attention to metrics should lead to reduction in project costs: • as quality improves • errors are minimized • rework reduced
estimation • first application of project metrics on SW project • metrics collected from past projects used as basis for time and effort estimates • as project advances, collect production rates and error metrics
3. Software Measurement • direct measures vs. indirect measures
direct measures • direct measure of process: • cost and effort • direct measure of product: • lines of code (LOC) • execution speed • defects per time period
Indirect measures • indirect measures of product: • functionality • quality • complexity • reliability • maintainability
Consolidation of metrics • individual metrics combined to develop project metrics • project metrics consolidated to create process metrics • how to combine metrics from different projects? • normalization - enables comparison
3.1 Size-oriented metrics • derived by normalizing quality and/or productivity measures • use size of the SW to normalize • size-oriented measures include: • LOC • effort • $ • errors • defects • people
normalizing • suppose choose LOC as normalization value • then can compare across projects: • errors per KLOC • defects per KLOC • $ per LOC
estimates • very important to estimate the associated cost of development early in the development project • to have accurate cost predictions, need accurate estimates of project size
Software size • primary factor affecting SW cost is the SIZE of the project • estimating SW size is DIFFICULT • most frequently used metrics for measuring size: • lines of code (LOC) • function points • some controversy regarding using LOC as key normalization measure
LOC pros: • easily counted (after the fact, once you choose a counting method) • used a lot
LOC cons: • lack of universally accepted definition for what a line of code really is (there are at least 11 different variations for counting LOC) • programming language dependent • difficult to use to estimate project size and effort - don’t have enough information at beginning of project to accurately estimate LOC
3.2 Function-oriented Metrics • use a measure of functionality as the normalization value • formula estimate • functionality cannot be measured directly, but must be derived using other (direct) measures • method of quantifying size and complexity of system in terms of functions that system delivers to user
fig. 4.5 computing function points measurement parametercountsimpleaveragecomplex 1. number of user inputs ??? 3 4 6 = X 2. number of user outputs ??? 4 5 7 = X 3. number of inquiries ??? 3 4 6 = X 4. number of files ??? 7 10 15 = X 5. number of external interfaces ??? 5 7 10 = X count=total XX
1. number of user inputs • each unique user input that provides application-oriented data to the SW • includes input that enter directly as transactions from the user, and those that enter as transactions from other applications (e.g. input file of transactions)
2. number of user outputs • each user output that provides application-oriented information to user (reports, screens, error messages, etc.) • include reports and messages to the user and reports and messages to other applications (e.g. files of reports and messages)
3. number of inquiries • inquiry is an on-line input that results in generation of an immediate SW response in form of an on-line output • each distinct inquiry is counted
4. number of internal files • include each logical file or if using a DB, logical grouping of data, that is generated, used and maintained by the application
5. number of external interfaces • files passed or shared between applications should be counted • i.e., machine-readable interfaces (e.g., data files on tape or disk) that are used to transmit information to another system are counted
to compute: 1. classify and count the five user function types 2. adjust for processing complexity determine complexity value associated with each count can develop criteria for determining whether simple, average or complex 3. make the function points calculation FP= count-total X [.65+.01X Fi Fi (i=1 to 14) are complexity adjustment values see table 4.1
answer questions such as: • answer questions such as: • Is performance critical? • Are the master files updated on-line? • Is the code designed to be reusable? • Use function points to normalize measures of SW productivity and quality.
FP Pros: • programming language independent • based on data more likely to be known early in the project (still need requirements specs. or design specs.; see Matson et al.)
FP Cons: • computation based on subjective data • designed to measure business-type applications (not good for technical or scientific applications)
4. Metrics for SW Quality • focus on the process, the project and the product (as do productivity metrics)
Factors that affect quality • product operation - using it • product revision - changing it • product transition - portability
Measuring quality • correctness • degree to which SW performs its required function • defects per KLOC - most common measure for correctness • maintainability • ease with which a program can be corrected, adapted, or enhanced
Measuring quality • MTTC - mean time to change - • simple metric - time it takes to analyze, implement change, test it, and distribute it to users • integrity • measures system’s ability to withstand attacks on its security
Measuring quality • usability • quantify user friendliness • measured using 4 characteristics 1. physical/intellectual skill required to learn the system 2. time required to become moderately efficient 3. net increase in productivity when system used 4. users attitudes toward the system
5. Integrating metrics within the SW process • majority of SW developers do not measure • problem is cultural • measurement results in cultural change • resistance, often due to fear
barriers to implementing process improvement methods (Paulish et al.) 1. getting started orgs. need to conduct an assessment (e.g. Capability Maturity Model) 2. staff turnover downsizing is difficult environment for process improvement need champions to stick around 3. dedicated resources need full-time dedicated resource(s) to implement process improvement methods
barriers to implementing process improvement methods (Paulish et al.) • 4. management support • it’s necessary • 5. time restrictions • you’ve got to make the time to institute it
Some preliminary recommendations (Paulish et al.) • 1. use capability maturity model as guide to improvement • it provides a framework showing which methods to use based on current maturity • 2. conduct an assessment at beginning • to identify priorities for improvement and build consensus within org.
Some preliminary recommendations (Paulish et al.) 3. pick a few process improvement methods implement these effectively 4. pay attention to implementation of methods includes good training and management 5. some process improvement methods easier to implement than others