Design Consolidation: Integration Issues
This document explores the integration and design consolidation of browser and builder functionality in data visualization tools. It highlights the importance of user interaction with tree and pivot tables, allowing quick accessibility to static data visualizations. The browser offers quick, analytical, and passive experiences, while the builder emphasizes task-directed, exploratory engagement. Key design considerations include search functionalities, dynamic chart controls, and the challenges posed by modality. By addressing these aspects, we aim to improve user understanding and functionality retention in software design.

Design Consolidation: Integration Issues
E N D
Presentation Transcript
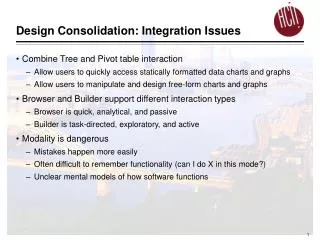
Design Consolidation: Integration Issues • Combine Tree and Pivot table interaction • Allow users to quickly access statically formatted data charts and graphs • Allow users to manipulate and design free-form charts and graphs • Browser and Builder support different interaction types • Browser is quick, analytical, and passive • Builder is task-directed, exploratory, and active • Modality is dangerous • Mistakes happen more easily • Often difficult to remember functionality (can I do X in this mode?) • Unclear mental models of how software functions
Design Consolidation: The Design • Browser functionality
Menus Search box for metrics Metrics “Browser Mode” Design Consolidation: The Design • Browser functionality • Search through the metrics using arrow keys • Search bar helps with finding particular metrics • Menus give users further options
Design Consolidation: The Design • Browser and Builder functionality • Option controls at left give further control • Chart-type radio buttons • Display years • Divisions to include • Includes toggle functionality to automatically select-all (and unselect-all) in a given box Select Chart Type Radio buttons Years to Compare Check boxes Add Divisions Check boxes
Design Consolidation: The Design • Key differences between Browser and Builder functionality Menus Search box for metrics Metrics “Browser Mode” Metrics “Builder Mode”
Design Consolidation: The Design • Builder functionality
Design Consolidation: The Design • Builder functionality • Mode selected at top • Yellow areas to drag metrics and time descriptions • Gray area for updating graph Mode Toggle Browser vs. Builder Drag and Drop Active areas