PHENIX Results from the RHIC Beam Energy Scan Program
560 likes | 754 Vues
PHENIX Results from the RHIC Beam Energy Scan Program. Jeffery T. Mitchell Brookhaven National Laboratory. The RHIC Beam Energy Scan Program: Probing the Nuclear Matter Phase Diagram.

PHENIX Results from the RHIC Beam Energy Scan Program
E N D
Presentation Transcript
PHENIX Results from the RHIC Beam Energy Scan Program Jeffery T. Mitchell Brookhaven National Laboratory
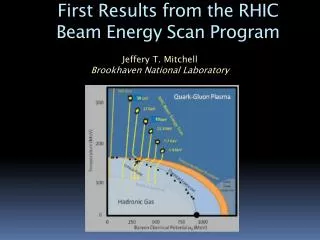
The RHIC Beam Energy Scan Program: Probing the Nuclear Matter Phase Diagram By systematically varying the RHIC beam energy, heavy ion collisions will be able to probe different regions of the QCD phase diagram. Searching for signatures of the onset of deconfinement. Searching for signatures of the critical point. decreasing √sNN Jeffery T. Mitchell - Fluctuations, Correlations, RHIC Low Energy Run - 10/3/11 2
The RHIC Beam Energy Scan Program: Overview Species: Gold + Gold Collision Energies [sqrt(sNN)]: 200 GeV (2010), 130 GeV (2001), 62.4 GeV (2010), 39 GeV (2010, 250M events), 27 GeV (2011), 19.6 GeV (2002 for 1 day, 2011 13M events), 11 GeV (2010, STAR only) 9.2 GeV (2009, short test run), 7.7 GeV (2010, 1.5M events) Species: Copper + Copper Collision Energies [sqrt(sNN)]: 200 GeV (2005), 62.4 GeV (2005), 22 GeV (2005) Species: Deuteron + Gold Collision Energies [sqrt(sNN)]: 200 GeV Species: Proton + Proton Collision Energies [sqrt(sNN)]: 500 GeV, 200 GeV, 62.4 GeV Jeffery T. Mitchell - Fluctuations, Correlations, RHIC Low Energy Run - 10/3/11 3
The PHENIX Detector at RHIC • Central arms: • Hadrons, photons, electrons • J/y→ e+e-;y’ → e+e-; • c→ e+e-; • |η|<0.35 • pe > 0.2 GeV/c • Δφ=π(2 arms x π/2) • Forward rapidity arms: • Muons • J/y→ μ+μ-; → μ+μ- • 1.2<|η|<2.2 • pμ > 1 GeV/c • Δφ = 2π RPC1 Jeffery T. Mitchell - Fluctuations, Correlations, RHIC Low Energy Run - 10/3/11 4
New in 2011: The VTX Detector • Fine granularity, low occupancy • 50mm×425mm pixels for L1 and L2 • R1=2.5cm and R2=5cm • Stripixel detector for L3 and L4 • 80mm×1000mm pixel pitch • R3=10cm and R4=14cm • Large acceptance |h|<1.2, almost 2p in f plane • Stand-alone tracking capability Pixel Will help with background rejection at low energies Strip The VTX was installed in PHENIX in Nov-Dec 2010. z plane f plane Jeffery T. Mitchell - Fluctuations, Correlations, RHIC Low Energy Run - 10/3/11 5
Triggering at Low Energy The placement of the trigger detectors (BBCs) are not optimized for low energy running. They have a reduced acceptance, especially below RHIC energies of ~ 20 GeV. Fermi motion comes to the rescue! At low energies, Fermi motion is enough to bring nucleons back into the BBC acceptance. Jeffery T. Mitchell - Fluctuations, Correlations, RHIC Low Energy Run - 10/3/11 6
PHENIX Trigger Performance at 7.7 GeV Tight timing cut on BBC North vs. South URQMD normalized to match real data integral for PC1 hits > 40. URQMD not matched to z distribution in real data. The triggerfires on 75% of the cross section. No indication of deviation oflow multiplicity eventsfrom background. Centrality determination uses the outer ring of the Reaction Plane detector: 1.5<|h|<2.8 URQMD AuAu @ 7.7 GeV through PHENIX full simulation PHENIX AuAu @ 7.7 GeV Data w/ BBCLL1(>0 tubes) |z| < 30 cm PHENIX AuAu @ 7.7 GeV Data w/ BBCLL1(>1 tubes) |z| < 30 cm Jeffery T. Mitchell - Fluctuations, Correlations, RHIC Low Energy Run - 10/3/11 7
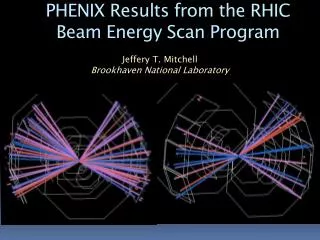
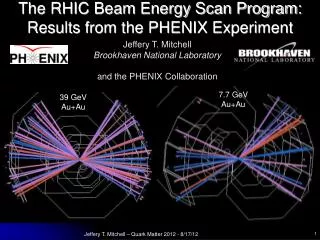
PHENIX 39 GeVAu+Au Event Displays Jeffery T. Mitchell - Fluctuations, Correlations, RHIC Low Energy Run - 10/3/11 8
PHENIX 7.7 GeVAu+Au Event Displays Jeffery T. Mitchell - Fluctuations, Correlations, RHIC Low Energy Run - 10/3/11 9
VTX Event Display – 19.6 GeVAu+Au Jeffery T. Mitchell - Fluctuations, Correlations, RHIC Low Energy Run - 10/3/11 10
Au+Au Charged Particle Multiplicity Black points from Phys. Rev. C71 (2005) 034908 62 GeV PHENIX Preliminary Error bars represent the systematic errors. The lines represent the “tilt” error due to the uncertainty in the trigger cross section. Jeffery T. Mitchell - Fluctuations, Correlations, RHIC Low Energy Run - 10/3/11 11
Au+Au Charged Particle Multiplicity Ratios There is relatively little variation in the centrality-dependent shape of the multiplicity from 200 to 7.7 GeV. Jeffery T. Mitchell - Fluctuations, Correlations, RHIC Low Energy Run - 10/3/11 12
Charged Particle Multiplicity:Excitation Function The multiplicity per participant pair increases linear with log(sqrt(sNN)). PHENIX and STAR results from the Run-10 RHIC beam energy scan are in agreement. Blue: PHENIX Red: STAR Black: AGS/SPS Jeffery T. Mitchell - Fluctuations, Correlations, RHIC Low Energy Run - 10/3/11 13
Searching for the Onset of Deconfinement: Energy Loss Measurements Jeffery T. Mitchell - Fluctuations, Correlations, RHIC Low Energy Run - 10/3/11 14
PHENIX RAA Measurements in 200 GeVAu+Au Collisions • From the 200 GeVAu+Aup0 measurement: • Strong suppression (x5) in central Au+Aucollisions • No suppression in peripheral Au+Aucollisions • No suppression (Cronin enhancement) in control d+Aucollisions • Convincing evidence for final state partonicinteractions Jeffery T. Mitchell - Fluctuations, Correlations, RHIC Low Energy Run - 10/3/11 15
PHENIX p0 Energy Loss Measurements in Cu+Cu Collisions PRL101, 162301 • From the Cu+Cuenergy scan: • Significant suppression at √sNN = 200 and 62.4 GeV • Moderate enhancement at √sNN = 22.4 GeV Jeffery T. Mitchell - Fluctuations, Correlations, RHIC Low Energy Run - 10/3/11 16
p0 invariant yields: Au+Au Collisions at 62.4 GeV 62.4 GeV • At lower √s the contribution from some processes are larger: • Running a(Q2) • PDF evolution • kT smearing • Higher-twist phenomena Jeffery T. Mitchell - Fluctuations, Correlations, RHIC Low Energy Run - 10/3/11 17
p0 invariant yields: Au+Au Collisions at 39 GeV 39 GeV The minimum bias spectra are fit with a power-law shape function for pT> 4 GeV/c : n200GeV=8.1 ± 0.03 n62GeV=10.9 ±0.03 n39GeV=12.1 ± 0.1 Jeffery T. Mitchell - Fluctuations, Correlations, RHIC Low Energy Run - 10/3/11 18
62.4 GeVp+p reference extrapolation • Data from PHENIX for p+p collisions are available up to pT< 7 GeV/c • To extrapolate to higher pTpoints, a power-law function was used: • The limit of the fits is important and contributes to the systematic errors. • The systematic uncertainty is calculated from the errors of the power-law fit • It agrees well with the CCOR data (ISR) in pT 7-10 GeV/c region Jeffery T. Mitchell - Fluctuations, Correlations, RHIC Low Energy Run - 10/3/11 19
39 GeVp+p reference • p+p data are measured only in the fixed-target experiment E706 at the Tevatron at a beam energy of 800 GeV. (Phys.Rev.D68:052001,2003) • The E706 has a different rapidity acceptance: • -1.0 < y < 0.5 (PHENIX |y|<0.35). • Acceptance correction based on a PYTHIA8 simulation. • The systematic uncertainty of the correction function is calculated based on the data to PYTHIA8 comparison. Acceptance correction function E706 PHENIX Jeffery T. Mitchell - Fluctuations, Correlations, RHIC Low Energy Run - 10/3/11 20
p0 RAA in Au+Au at 39 and 62 GeV • p0 RAA as a function of pT in PHENIX at √sNN = 39, 62 and 200GeV. • Still observe a strong suppression (factor of 2) in the most central √sNN = 39 GeV collisions. • RAAfrom √sNN = 62 GeV data is comparable with the RAAfrom √sNN = 200 GeV for pT 6 >GeV/c. • Peripheral √sNN = 62 and 200 GeVdata show suppression, but the √sNN = 39 GeVdoes not. Jeffery T. Mitchell - Fluctuations, Correlations, RHIC Low Energy Run - 10/3/11 21
p0RAA : Centrality Dependence • Large suppression is observed at 200 and 62 GeV. • 39 GeVAu+Au shows suppression only for Npart>100 Jeffery T. Mitchell - Fluctuations, Correlations, RHIC Low Energy Run - 10/3/11 22
Energy and System-Dependence ofp0 RAA • System size: • Circles: Cu+Cu • Squares: Au+Au The RAA values seem to have the same trend. But, the scaling does not work for all pT ranges. SPS, max reach SPS, max reach: 2 × 208(Pb) × 17.3 GeV (√sNN)/2 = 3598.4 GeV Jeffery T. Mitchell - Fluctuations, Correlations, RHIC Low Energy Run - 10/3/11 23
fK+K- Spectra in 62.4 GeVAu+Au Collisions Jeffery T. Mitchell - Fluctuations, Correlations, RHIC Low Energy Run - 10/3/11 24
fK+K- RAA in 200 GeVAu+Au Collisions The f is suppressed in central 200 GeVAu+Au collisions. The RAA of the f lies between that of the proton and the p0. Jeffery T. Mitchell - Fluctuations, Correlations, RHIC Low Energy Run - 10/3/11 25
fK+K- RAA in 62.4 GeVAu+Au Collisions Within the current precision, no suppression at 62.4 GeV. Similar to the 200 GeV results, the RAA of the f lies between that of the proton and the p0. Jeffery T. Mitchell - Fluctuations, Correlations, RHIC Low Energy Run - 10/3/11 26
J/ψYieldsfrom 62 and 39 GeVAu+Au Collisions In 2010, PHENIX collected 700M (250M) MB events from 62.4 GeV (39 GeV) Au+Au collision. Rapidity 1.2 <|y| <2.2 Jeffery T. Mitchell - Fluctuations, Correlations, RHIC Low Energy Run - 10/3/11 27
Energy Dependence of J/y Suppression Less suppression is observed in central collisions at LHC energies. Jeffery T. Mitchell - Fluctuations, Correlations, RHIC Low Energy Run - 10/3/11 28
Energy dependence of J/ψRCP Rapidity 1.2 <|y| <2.2 • PHENIX does not yet have a p+p reference at 62 and 39 GeV. • Lacking a reference, RCP can still give us insight about the suppression level. • The suppression is at a similar level at all energies. Jeffery T. Mitchell - Fluctuations, Correlations, RHIC Low Energy Run - 10/3/11 29
PHENIX Dilepton Expectations at 39 GeV How does the dilepton excess and ρ modification at SPS evolve into the large low-mass excess at RHIC? If the excess is the same at 39 GeV as at 200 GeV, we expect a 6s result. Addition of Hadron Blind Detector will significantly reduce background. PRC81, 034911 (2010) Jeffery T. Mitchell - Fluctuations, Correlations, RHIC Low Energy Run - 10/3/11 30
Searching for the onset of deconfinement: Flow Measurements v2>0: in-plane emission of particles v2<0: squeeze-out perpendicular to reaction plane. Jeffery T. Mitchell - Fluctuations, Correlations, RHIC Low Energy Run - 10/3/11 31
Elliptic Flow at 62 and 39 GeV: p0 There is little change in the magnitude of v2 from 39 GeV to 200 GeV. Jeffery T. Mitchell - Fluctuations, Correlations, RHIC Low Energy Run - 10/3/11 32
v2{2}, v3{3}, v4{4} at 62 GeVAu+Au vn charged particle vn : ||<0.35 reaction plane n : ||=1.0~2.8 Jeffery T. Mitchell - Fluctuations, Correlations, RHIC Low Energy Run - 10/3/11 33
v2, v3, v4as a function ofsNN v2, v3, v4are independent of sNNfor 39, 62.4, 200 GeV Jeffery T. Mitchell - Fluctuations, Correlations, RHIC Low Energy Run - 10/3/11 34
v2in 7.7 GeVAu+Au Collisions The magnitude of v2at 7.7 GeV is significantly lower than the magnitudes at 39, 62 and 200 GeV Jeffery T. Mitchell - Fluctuations, Correlations, RHIC Low Energy Run - 10/3/11 35
v2vspT from 39 GeVto 2.76 TeV ALICE Experiment, PRL105,252302 (2010) It appears that the system demonstrates similar hydrodynamic properties from 39 GeVto 2.76 TeV Jeffery T. Mitchell - Fluctuations, Correlations, RHIC Low Energy Run - 10/3/11 36
Saturation of v2 with beam energy v2 saturates for a given pT around or below 39 GeV Almost perfect fluidity from 39 GeVto 2.76 TeV Jeffery T. Mitchell - Fluctuations, Correlations, RHIC Low Energy Run - 10/3/11 37
Saturation of v3, v4 with beam energy • v2, v3 and v4 are measured in 39, 62 and 200 GeV. The magnitudes are similar. • The observations suggest similar initial geometry fluctuations and dynamical evolution of nuclear matter above 39 GeV. vn(Ψn) Jeffery T. Mitchell - Fluctuations, Correlations, RHIC Low Energy Run - 10/3/11 38
Identified hadron v2in 62.4 GeVAu+Au Collisions PHENIX Preliminary Partonic collective flow is observed down to 62 GeV and … Jeffery T. Mitchell - Fluctuations, Correlations, RHIC Low Energy Run - 10/3/11 39
Identified hadron v2in 39 GeVAu+Au Collisions PHENIX Preliminary PHENIX Preliminary Partonic collective flow is observed down to 39 GeV Jeffery T. Mitchell - Fluctuations, Correlations, RHIC Low Energy Run - 10/3/11 40
Searching for Signatures of the Critical Point: Fluctuations and Correlations Jeffery T. Mitchell - Fluctuations, Correlations, RHIC Low Energy Run - 10/3/11 41
Phys.Rev. C 77, 011901 (2008) PRL 98, 232302 (2007) Two-Particle Correlations: 200 and 62 GeV h - h correlations 1 < pTa < 2.5 < pTt< 4GeV/c With increasing Npart the away side jets broaden and move away from each other but remain flat over most of Npart Jeffery T. Mitchell - Fluctuations, Correlations, RHIC Low Energy Run - 10/3/11 42
Two-Particle Correlations:v3 and the Double Hump Structure • v2 correction only • double-hump • v2, v3, v4 correction • double-hump disappears • Peak still broadened
Like-Sign Pair Azimuthal Correlations 0.2 < pT,1 < 0.4 GeV/c, 0.2 < pT,2 < 0.4 GeV/c, |D pseudorapidity|<0.1 200 GeV Au+Au, 0-5% Central PHENIX Preliminary 62 GeV Au+Au, 0-5% Central PHENIX Preliminary C(Df) = (dN/dfdata/dN/dfmixed)*(Nevents,mixed/Nevents,data) Assuming that QCD belongs in the same universality class as the (d=3) 3-D Ising model, the expected value of h is 0.025 (Reiger, Phys. Rev. B52 (1995) 6659 . • The power law function fits the data well for all species and centralities. Jeffery T. Mitchell - Fluctuations, Correlations, RHIC Low Energy Run - 10/3/11 44
C(Dp)Exponent h vs. Centrality PHENIX Preliminary, Like-Sign Pairs, |Dpseudorapidity| < 0.1 The exponent h is independent of species, centrality, and collision energy. The value of h is inconsistent with the d=3 expectation at the critical point (0.025 for 3-D Ising). Jeffery T. Mitchell - Fluctuations, Correlations, RHIC Low Energy Run - 10/3/11 45
Multiplicity Fluctuations 62 GeVCu+Cu 200 GeVCu+Cu The black points are the data. The dashed red lines are Negative Binomial Distribution fits to the data. Multiplicity fluctuations are quantified as the scaled variance: wch,dyn = variance/mean, corrected for impact parameter fluctuations 200 GeVp+p 22.5 GeVCu+Cu Jeffery T. Mitchell - Fluctuations, Correlations, RHIC Low Energy Run - 10/3/11 46
Multiplicity Fluctuations Near the critical point, the multiplicity fluctuations should exceed the superposition model expectation No significant evidence for critical behavior is observed. Low energy results are being prepared. wch,dyn = variance/mean, corrected for impact parameter fluctuations. Jeffery T. Mitchell - Fluctuations, Correlations, RHIC Low Energy Run - 10/3/11 47
Summary and Outlook • Multiplicity: Linear scaling with log(sqrt(sNN)). • RAA: • p0 RAA at 39 GeV still shows a large suppression. • Initial measurements show suppression of J/Y at 39 and 62 GeV. • No significant suppression is observed for the f at 62 GeV. • Flow: • v2 ,v3, v4 saturates at intermediate pT at 39 and 62 GeV. • Quark number scaling holds at 39 and 62 GeV. • v2 at 7.7 GeV is significantly lower than v2 at 39 and 62 GeV. • Outlook: • Many measurements are being analyzed from the new datasets at 7.7, 19.6, 27.0, and 39.0 GeV, including: • multiplicity, net charge, and transverse momentum fluctuations • local parity violation • identified particle spectra • 2-particle correlations • dilepton spectra • Stay tuned for much more! Jeffery T. Mitchell - Fluctuations, Correlations, RHIC Low Energy Run - 10/3/11 48
Auxiliary Slides Jeffery T. Mitchell - Fluctuations, Correlations, RHIC Low Energy Run - 10/3/11 49
Comparison with recent SPS RAA • In previous experiment at WA98 we see only (PRL 100 (2008), 242301) suppression at “ultra”-central (0-1%) collisions of Pb+Pb. • The xT is overlapping between the SPS and RHIC intervals. • The “onset” of the energy loss is dependent on system size and collision energy. • The energy loss is present in lower energies also. The magenta closed circles are the most comparable with the PHENIX results, as they have the smaller system (p+C) for reference. The “onset” of the suppression depends on collision energy and centrality or system size (and pT) Jeffery T. Mitchell - Fluctuations, Correlations, RHIC Low Energy Run - 10/3/11 50