Download
1 / 32
320 likes | 449 Vues
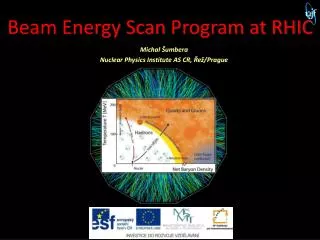
PHENIX Results from the RHIC Energy Scan. Edward O’Brien Quark Matter 2012 Washington, DC August 17, 2012. Baryon Chemical Potential B (GeV). The Physics Motivation. Use the flexibility of RHIC to carry out detailed energy and species scans with the point of determining:

E N D
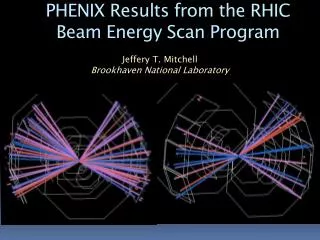
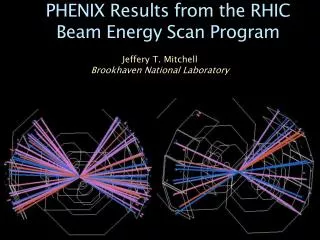
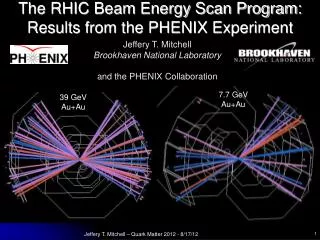
PHENIX Results from the RHIC Energy Scan Edward O’Brien Quark Matter 2012 Washington, DC August 17, 2012 Edward O’Brien
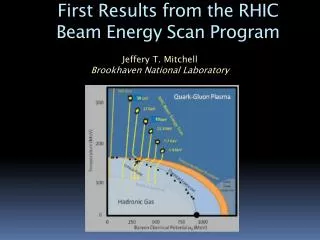
Baryon Chemical Potential B (GeV) The Physics Motivation Use the flexibility of RHIC to carry out detailed energy and species scans with the point of determining: • The evolution from partonic to hadronic matter through the QCD crossover region - QGP transition • Location, if any, of a critical point on the QCD phase diagram Edward O’Brien
Physics Results of Energy and Species Scan • Global variables • RAA • Flow Edward O’Brien
RHIC Run History RHIC’s exceptional flexibility has enabled a Physics program of broad scope Edward O’Brien 12 Years, 12 Runs, 10 Energies, 6 Combination of Species
RHIC Run History 12 Years, 12 Runs, 10 Energies, 6 Combination of Species Approximately half of RHIC’s running time has contributed in to the energy and species scan studies Edward O’Brien
Global Variable dN/dh Npart Npart Edward O’Brien
Global Variables dET/dh Npart Npart Edward O’Brien
Global Variables eBj Bj = 1/A(dET/dy) Bj (GeV/fm2/c) Bj (GeV/fm2/c) Npart Npart Edward O’Brien
A Look at New “Raw” Data 1/N Events dN/dNRaw Uncorrected multiplicity and ET data for recent U+U and Cu+Au RHIC run superimposed on raw multiplicity and ET distributions from pp, dAu, CuCu and AuAu data sets Raw Multiplicity 1/N Events dN/dETRaw J. Mitchell Friday 7B Edward O’Brien Raw ET (GeV)
Fluctuations in Global Variables HI collisions that pass close to a QCD critical point might demonstrate observable large fluctuations in correlation lengths of particular global variables. Correlation length is Then Variance : 2 = <(N)2> ~ 2 Skewness: S = <(N)3>/3 ~ 4.5 Kurtosis: K = <(N)4>/4 ~ 7 The strategy is to vary √s and look for a sudden change in correlation length Lattice calculations say we don’t have to hit a bulls eye on the critical point. We just have to come close to see the fluctuations in Edward O’Brien
Net ChargeDistributions Net-charge (Nq = N+ - N- ) Net-charge (Nq = N+ - N- ) • Correlation length related to moments of conserved quantities including net charge • Correlation length should diverge at the critical point in the phase diagram Edward O’Brien
Net Charge Moments They scale as correlation length Edward O’Brien
UrQMD √sNN Dependence of Net Charge Fluctuations • Neither K nor S vary with centrality at 7.7, 39, 62.4 and 200 GeV • Kurtosis vs energy is flat within errors • Skewness tracks UrQMD prediction • Analysis of data sets from √s = 19.6, 27 GeV still to be completed Edward O’Brien
w Multiplicity fluctuations ch,dyn = <N>/var(N) corrected for impact parameter fluctuations Mean multiplicity fluctuation flat for these 4 collision energies Analysis of data sets from √s = 19.6, 27 GeV still to be completed Edward O’Brien
Global Variable Summary • Global analysis of dN/d, dET/d and Bj vs. centrality performed for data sets at √s = 200, 130, 62.4, 39, 27, 19.6 and 7.7 GeV • Gradual evolution of the quantities with centrality and √s has been observed • No obvious non-monotonic behavior at these collision energies • U+U data @ √s = 193 GeV shows ~20% higher dET/d and Bj than Au+Au 200 GeV data at the most central collisions. • Maximum U+U dN/d shows no increase over Au+Au dN/d • Fluctuation analyses have been performed for net charge and multiplicity fluctuations at √s = 200, 62.4, 39 and 7.7 GeV • No obvious non-monotonic behavior at these collision energies • Analysis of data sets from 27 and 19.6 GeV are on the way Edward O’Brien
RAA 0 From our 2008 paper PRC 101, 162301 Edward O’Brien
RAA 0 Submitted to PRL arXiv:1204.1526v1 Edward O’Brien
RAA 0 Submitted to PRL arXiv:1204.1526v1 RAA analysis of 27 GeV data is underway Edward O’Brien
RAA J/ Submitted to PRC arXiv:1208:2251 Edward O’Brien
RAA Summary • Jet quenching observed in central Au+Au collisions at √s = 39, 62.4 GeV is similar to but not as strong as RAA seen in Au+Au 200 GeV data • Less suppression as a function of √s vs pT and centrality • RAA ~ 1 for mid-peripheral (40-60%) Au+Au 39 GeV • Analysis of 0 RAA for 27 GeV Au+Au is underway • J/psi suppression is very similar at all Npart for particles produced in collisions of 200, 62.4 and 39 GeV (1.2 < |y| < 2.2) Edward O’Brien
Flow v2, v3 , K, p Edward O’Brien
Flow v2, v3 , K, p Edward O’Brien
NCQ scaling of v2, v3 Edward O’Brien
Flow Summary • New v2 and v3 with PID have been measured in 62.4 and 39 GeV Au+Au data • 200, 62.4 and 39 GeV PID data shows the same v2, v3 values. Observed flow is saturated in this energy range • NCQ scaling of vn for identified charged hadrons, KET/nq < 1 GeV observed for the beam energy range of 39–200 GeV confirms partonic flow down to 39 GeV Edward O’Brien
Conclusions - 1 • A large fraction of the extensive RHIC data set contributes to the energy and species scan • Data has been analyzed at 7.7, 19.7, 27, 39, 62.4, 130, 193 and 200 GeV • A gradual evolution for dN/d, dET/d and Bj vs √s and Npart • Bj of U+U ~ 20% higher than Au+Au • No significant increase in the dN/d seen in U+U • Net charge and multiplicity fluctuation analyses have been performed at 7.7, 39, 62.4 and 200 GeV • No non-monotonic behavior observed within sensitivity. • Additional data at 27 and 19.6 GeV to be analyzed • Energy loss similar to that observed in 200 GeV Au+Au RAA is seen in 62.4 and 39 GeV data • The energy loss weakens as we decrease √s and centrality • J/ suppression is very similar at all Npart for particles produced in collisions of 200, 62.4 and 39 GeV (1.2 < |y| < 2.2) Edward O’Brien
Thank You Conclusions - 2 • 200, 62.4 and 39 GeV PID data shows the same v2, v3 values • NCQ scaling of vn seen for, K, p observed in range 39–200 GeV confirms partonic flow down to 39 GeV Edward O’Brien
Back Up Edward O’Brien
v 2,3,4 of Charged Hadrons vs√s • Charged hadron results for v2, v3 and v4 consistent with saturation of identified charged particles vn for beam energies of 39-200GeV Edward O’Brien
Excitation plot of v2 and ET/particle Edward O’Brien
Global Variables dET/dh Edward O’Brien
Initial geometry HBT systematics • System volume from 3D HBT as a analysis function of entropy density • PHENIX data follow the global linear trend Edward O’Brien
HBT Edward O’Brien