Download
1 / 18
180 likes | 306 Vues
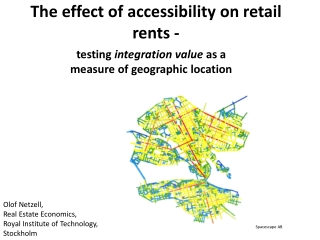
testing integration value as a measure of geographic location. The effect of accessibility on retail rents -. Olof Netzell , Real Estate Economics, Royal Institute of Technology, Stockholm. Spacescape AB. Integration values. Morphological map of the urban area under study.

E N D
testing integration value as a measure of geographic location The effect of accessibility on retail rents - Olof Netzell, Real Estate Economics, Royal Institute of Technology, Stockholm Spacescape AB
Integration values • Morphologicalmap of the urban area under study • Cover the public area with sight-lines (axial lines) • Convert the axial mapinto a mathematicalgraph
Integration values • Meandepth of a node = meannumber of (minimum) steps from a node to all othernodes
Interpretation of integration values • Fewturns to reachotherstreet segments = high integration values • Integration valuecan be defined up to a certainnumber of steps/turns
Hypothesis • Integration valuescorrelated with pedestriantraffic • Can integration valuesexplainretail rents? • Regress retail rents on integration values
Data • Integration values of streets in Stockholm • Survey to shops askingabouttheirlocation and rentalcontracts
The regression Dependentvariable: Rent per square meter ”Main” explanatory variables (expectedsign): -Integration value (+) - Distanceto CBD (-) Control variables variables (expectedsign): • Proportion of area that is shop area (+) • Area (?) • Shop located in mall, dummy (+) • Notindexed rent, dummy (+?) • Turnoverbased rent, dummy (+) • Property tax included in rent, dummy (+) • New shop, dummy (+) • Discount on rent for parts of the contract period, dummy (+) • Shop not on streetlevel, dummy (-)
The regression • Multiplicative form
Integration values • Morphologicalmap of the urban area under study • Cover the public area with convexspaces
Integration values • Draw sight-lines (axial lines) that cross all convexspaces • Axial map
Integration values • Convert the axial mapinto a mathematicalgraph
Example Hillier 1996
Integration values • Meandepth of a node = meannumber of (minimum) steps from a node to all othernodes • Relative asymmetry = meandepthstandardized to the interval 0-1
Integration values • RAdepends on the number of nodes • Real relative asymmetry • is the RA of a standardizednode in a standardizedgraph of sizeL • Main component: meandepth