Download
1 / 17
180 likes | 445 Vues
Power Provisioning for a Warehouse-sized Computer. Xiaobo Fan, Wolf-Dietrich Weber, Luiz Andre Barroso Google. Big machines. “Some of the most interesting computing systems being built today look more like a warehouse than a refrigerator.” Datacenters are expensive

E N D
Power Provisioning for a Warehouse-sized Computer Xiaobo Fan, Wolf-Dietrich Weber, Luiz Andre Barroso Google
Big machines • “Some of the most interesting computing systems being built today look more like a warehouse than a refrigerator.” • Datacenters are expensive • Construction cost rivals that of the energy cost over a datacenter’s lifetime • Operating as close to maximum capacity is important to amortize construction cost • Over-provisioning allows them to stretch to the power budget • (With safety valves in case they mess up) • Three main complications: • Actual power consumption of machines is less than advertised • Power varies with workload activity • Different workloads use different amounts of power
Construction vs. electricity costs • Fixed construction costs • $10 - $20 per Watt of peak critical power • Variable electricity costs • $0.80/Watt-year (or less if you have your own hydroelectric plant) • Claim: if facility operates at 85% of peak capacity, the building cost is will be higher than 10 years of electricity costs
Contributions • Analysis of three large-scale workloads on several thousand servers over six months • Web search, GMail, general Map/Reduce • Simple power estimation model • Based on workload’s CPU load • Exploit over-provisioning while staying within power budget • A few others • Voltage scaling, power capping, etc.
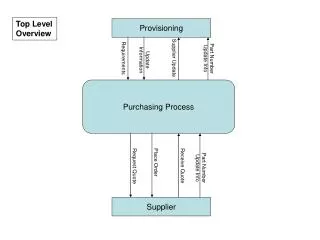
ATS (Automatic transfer switch) Switch between mains and generator STS (Static transfer switch) Switch between UPSes PDU (Power distribution unit) Transform down to 110v for racks Power distribution
Overall sources of inefficiency • Staged deployment • Facility is brought online in stages • Fragmentation • e.g., 2.5kW circuit can only support 4 520W servers, leaving 0.42kW stranded (17%) • Conservative power ratings • Server nameplate power doesn’t match reality • Variable workload • Some machines are idle, etc. • Statistical effects • Increasingly unlikely that large groups of systems will be at peak activity as group grows in size • Other • Cooling, conversion, etc.
“Typical” server power budget: 213W 251W assuming 85% efficiency They measured 145W for this system CPUs and memory dominate And correlate best with CPU load Nameplate vs. actual peak power
Estimating server power usage • Ran a suite of benchmarks and microbenchmarks on a single server “under variable loads” • First measured total system power against CPU utilization • Then compared against actual power measurement at PDU
Estimating server power usage CPU utilization is agood predictor ofsystem power
Estimating server power usage Model validates to within 1%(with a fixed offset dueto network switch load) CPU and memory aredominant contributors andhave widest dynamic range
Workloads • Websearch • High throughput, large data processing for each request • Webmail • More disk intensive • More disks per node, fewer servers/request • Mapreduce • Cluster for offline batch MapReduce jobs • Shared by several users • Workloads are well-tuned and run at high activity levels
Websearch CDFs • Room for over-provisioning at the cluster level: • 7.5% more machines could be safely added 7.5%
Webmail CDFs • Room for over-provisioning at the cluster level: • 16% more machines could be safely added • Maximum draw is lower than Websearch • Less dynamic range due to more disks 16%
Mapreduce CDFs • Room for over-provisioning at the cluster level: • 11% more machines could be safely added • Larger range than other apps • Less time-dependent activity 11%
Mixed workloads • Diversity narrows dynamic range and lowers peak power
Real datacenter • Narrow dynamic range and lower peak power • Room for 39% more machines
Other approaches • Power capping • Set peak power lower, allow more machines • Throttle or scale CPU voltage of processors that are in the top region of the CDFs • CPU V/F scaling (DVS) • 11-18% improvement • Improve non-peak power efficiency