Download
1 / 4
Educational Performance Analysis by Subgroup, ACT Scores Examination
40 likes | 139 Vues
Explore detailed performance data of students in reading and math by subgroups, and compare ACT scores above 21 for better understanding of academic achievement trends.
Télécharger la présentation 
Educational Performance Analysis by Subgroup, ACT Scores Examination
An Image/Link below is provided (as is) to download presentation
Download Policy: Content on the Website is provided to you AS IS for your information and personal use and may not be sold / licensed / shared on other websites without getting consent from its author.
Content is provided to you AS IS for your information and personal use only.
Download presentation by click this link.
While downloading, if for some reason you are not able to download a presentation, the publisher may have deleted the file from their server.
During download, if you can't get a presentation, the file might be deleted by the publisher.
E N D
Presentation Transcript
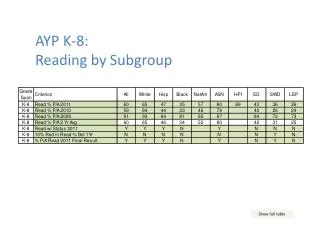
AYP K-8: Reading by Subgroup Show full table
AYP K-8: Math by Subgroup Show full table


More Related