Basic Econometrics Chapter 2 :
Basic Econometrics Chapter 2 :. THE NATURE OF REGRESSION ANALYSIS. . Historical origin of the term “Regression”. The term REGRESSION was introduced by Francis Galton

Basic Econometrics Chapter 2 :
E N D
Presentation Transcript
Basic EconometricsChapter 2: THE NATURE OF REGRESSION ANALYSIS
. Historical origin of the term “Regression” • The term REGRESSION was introduced by Francis Galton • Tendency for tall parents to have tall children and for short parents to have short children, but the average height of children born from parents of a given height tended to move (or regress) toward the average height in the population as a whole (F. Galton, “Family Likeness in Stature”) • Galton’s Law was confirmed by Karl Pearson: The average height of sons of a group of tall fathers < their fathers’ height. And the average height of sons of a group of shortfathers > their fathers’ height. Thus “regressing” tall and short sons alike toward the average height of all men. (K. Pearson and A. Lee, “On the law of Inheritance”) • By the words of Galton, this was “Regression to mediocrity”
Statistical vs.Deterministic Relationships • In regression analysis we are concerned with STATISTICAL DEPENDENCEamong variables (not Functional or Deterministic), we essentially deal with RANDOM or STOCHASTIC variables (with the probability distributions
Regression vs. Causation • Regression does not necessarily imply causation. A statistical relationship cannot logically imply causation. “A statistical relationship, however strong and however suggestive, can never establish causal connection: our ideas of causation must come from outside statistics, ultimately from some theory or other” (M.G. Kendal and A. Stuart, “The Advanced Theory of Statistics”)
Regression vs Correlation • Correlation Analysis: the primary objective is to measure the strength or degree of linear association between two variables (both are assumed to be random) • Regression Analysis: we try to estimate or predict the average value of one variable (dependent, and assumed to be stochastic) on the basis of the fixed values of other variables (independent, and non-stochastic)
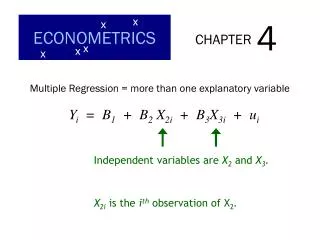
1-6. Terminology and Notation Dependent Variable Explained Variable Predictand Regressand Response Endogenous Explanatory Variable(s) Independent Variable(s) Predictor(s) Regressor(s) Stimulus or control variable(s) Exogenous(es) Prof.VuThieu
The Nature and Sources of Data for Econometric Analysis Types of Data : • Time series data; • Cross-sectional data; • Pooled data 2) The Sources of Data 3) The Accuracy of Data
The method of ordinary least square (OLS) • OLS estimators are expressed solely in terms of observable quantities. They are point estimators • The sample regression line passes through sample means of X and Y
The assumptions underlying the method of least squares • Ass 1: Linear regression model • (in parameters) • Ass 2: X values are fixed in repeated • sampling • Ass 3: Zero mean value of ui: E(uiXi)=0 • Ass 4: Homoscedasticity or equal • variance of ui: Var (uiXi) = 2 • [VS. Heteroscedasticity] • Ass 5: No autocorrelation between the • disturbances:Cov(ui,ujXi,Xj ) = 0 • with i # j [VS. Correlation, + or - ] • Ass 6: Zero covariance between ui and Xi • Cov(ui,Xi) = E(ui, Xi) = 0 • Ass 7: The number of observations n must be greater than the number of parameters to be estimated • Ass 8: Variability in X values. They must not all be the same • Ass 9: The regression model is correctly specified • Ass 10: There is no perfect multicollinearity between Xs