Download
1 / 30
300 likes | 337 Vues
This research provides an overview of statistical genetics focusing on identifying chromosomal regions harboring genes predisposing diseases or affecting traits. It covers genetic linkage analysis incorporating quantitative traits and likelihood formulation for linkage studies. The study includes examples on asthma and autism and discusses QTL analysis. Microarray analysis techniques for identifying gene expressions in diseases are also explored.

E N D
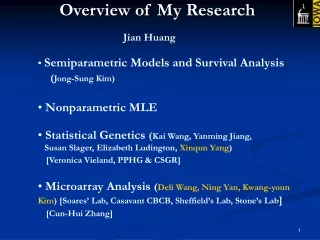
Overview of My Research Jian Huang • Semiparametric Models and Survival Analysis • (Jong-Sung Kim) • Nonparametric MLE • Statistical Genetics (Kai Wang, Yanming Jiang, • Susan Slager, Elizabeth Ludington, Xinqun Yang) • [Veronica Vieland, PPHG & CSGR] • Microarray Analysis (Deli Wang, Ning Yan, Kwang-youn Kim)[Soares’ Lab, Casavant CBCB, Sheffield’s Lab, Stone’s Lab] • [Cun-Hui Zhang]
Statistical Genetics Main Goal: find chromosomal regions harboring genes that predispose diseases or affect traits of interest
Genetic Linkage Analysis of a Dichotomous Trait Incorporating a Quantitative trait If a quantitative trait is linked to the same chromosomal regions as the disease, then joint analysis of disease status and the quantitative trait should in general increase the power to detect linkage. Huang J and Jiang Y (2003): American Journal of Human Genetics, 72: 949-960.
Example Asthma: Associated quantitative trait: total serum IgE level [Sandford et al. 1993, Wjst et al. 1999]. QTL analysis of total IgE level [Marsh et al. 1994, Meyers et al. 1994,Daniels et al. 1996, Laitinen et al. 1997, Palmer et al. 1998 ......] Autism: Possibly associated quantitative scorebased on: Spoken language, social empathy, compulsions, imitation, milestone, head circumference, etc. [Piven 2001]
Example: Asthma German asthma genome scan data [Wjst et al. 1999, Genetic Analysis Workshop 12] 97 families with 415 individuals: 91 families with affected sib-pairs (ASPs) 6 families with affected sib-triosAll affected children: Total serum IgE level331 markers on 22 autosomal chromosomes(about 10cM apart) are typed for each individual.
Likelihood Data: Pedigree structure Dichotomous trait: T Quantitative trait: Y Marker: M Likelihood: P(Y,M,T| ascertainment) If ascertainment is based on the trait T: P(Y, M|T)
Likelihood Putative locus: x
Identity by Descent (IBD) B A 1 2 3 4 A B 13 14 23 24 24 23 14 13 IBD=0 13 13 14 14 23 23 24 24 14 23 13 24 13 24 14 23 IBD=1 13 14 23 24 13 14 23 24 IBD=2
Likelihood: Formulation • Families in a linkage study are usually collected based on the • phenotypes of the individuals • Likelihood should be based on the distribution conditional on • the phenotype on which the ascertainment is based • Pleiotropy or tight coincident linkage
Likelihood:Asymptotic Distribution • The asymptotic null distribution of the LR statistic is nonstandard: disappears under • The asymptotic null distribution of the LR statistic is unknown • Conservative null distribution:
Simulation:Null Distribution n = 100 ASPs # of replications = 100,000
Microarray Analysis • Normalization • Identifying differentially expressed genes • Finding groups of co-regulated genes • Finding molecular finger prints of various types of cancer • Understanding how genes regulate development • Inferring gene networks
Microarray Schematic Duggan, et. al. Nature Genetics (1999) 21:10-14.
Blocks 4.5 mm 4 1 2 3 4 1 2 3 4 5 6 7 8 6 7 5 8 9 10 11 12 9 10 11 12 13 14 15 16 13 14 15 16 18 19 20 17 21 22 23 24 Printing configuration: 4 x 4 pins (1-16 and 17-32) Block 1 and 17, 2 and 18, 3 and 19, … are printed by the same pin 25 26 27 28 29 30 31 32 Courtesy of Liliana Menzella of Soares’ Lab
Data File Example (Part of Slide AAE-248) ---- Red (Cy5) channel
Expression Data • Background subtracted intensities: Red Channel (Cy5): R Green Channel (Cy3): G • Log Intensity Ratio log2(R/G) = 0 Constant expression > 0 R up-regulated < 0 R down-regulated Total Intensity 0.5*log2(R*G) =0.5*[log2(R) + log2(G)]
Expression Data Matrices: I---II Log intensity ratio Log intensity product
Comparison of normalization curves (Data from Callow et al. 2000) Green: TW-SRM normalization Red: loess normalization
A Two-way Semiparametric Regression Model (TW-SRM) Observed intensity = normalization curve (bias) + signal + random error The TW-SRM The SRM
Results Loess and T-test TW-SRM
Results Loess and T-test TW-SRM
Problem: An Infinitely Semiparametric Model and Parameters: Asymptotic analysis?