Download
1 / 70
700 likes | 718 Vues
Explore the successful use of permanganate for DNAPL removal in a sand aquifer. Learn about density-driven distribution, inject-and-leave technique, and performance assessment with minimal uncertainty.

E N D
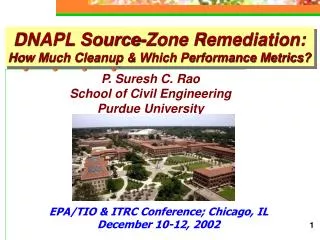
Full-Scale Permanganate Remediation of a Solvent DNAPL Source Zonein a Sand Aquifer Beth L. Parker, Ph.D. University of Waterloo Presented at the EPA Seminar: In Situ Treatment of Groundwater Contaminated With Non-Aqueous Phase Liquids Chicago December 11, 2002 1
Collaborators • Tom Al, University of New Brunswick • Inorganic Geochemistry • Ramon Aravena, University of Waterloo • Isotope Geochemistry • John Cherry, University of Waterloo
This Case Study Will Show: • Density driven distribution of KMnO4 in sand • Performance assessment with minimal uncertainty • Nearly complete destruction of TCE and 1,1,1-TCA
Two General Approachesfor In Situ Oxidation • Inject-and-withdraw (active) Flushing • Inject-and-leave (passive) Episodic Injection
The Active Approach Addition of Treatment Chemicals Withdrawal Injection B.L.Parker
The Waterloo Passive Approach • Use density and dispersion effects to distribute permanganate solution • Inject in a manner that minimizes groundwater displacement
( h i g h d e n s i t y ) K M n O The Waterloo Passive Approach Relies on density and dispersion effects 4 1 2 3 S a n d a q u i f e r B.L.Parker, 1997
n o l a t e r a l g r o u n d w a t e r f l o w 1 C o n c e n t r a t i o n a n d D e n s i t y D e c r e a s e 2 3 e m i t 4 Evolution of a Single Disc in a Sand Aquifer B.L. Parker, 1997 8
Initial Proof - of - ConceptInject-and-Leave Field Trial in Borden Aquifer Matthew Nelson M.Sc. Thesis (1999) Supervisors: Drs. Beth Parker and John Cherry University of Waterloo 9
System Set-up at 9m Cell Borden Site 11
o 20 C o 10 C Density of Dissolved KMnO4 in Water 1.05 1.04 Typical Range Used 1.03 sea water relative density solubility 1.02 1.01 1 0 20 40 60 grams per liter KMnO4
SETTING 0 ft sand 1 ft 12 ft clay
(g/l) KMnO 4 0 5 10 2.2 ML-1 First Injection 2.4 2.6 Day 1 Day 3 Depth (m.b.g.s.) 2.8 Day 8 Day 23 3.0 Day 65 3.2 3.4 Evidence for Density Induced Flow (Nelson, 1999) 14
The Waterloo Passive Approach • Use density and dispersion effects to distribute permanganate solution • Inject in a manner that minimizes groundwater displacement
K M n O 4 d i s p e r s i o n c o n t a m i n a t e d w a t e r z o n e d i s p l a c e d b y i n j e c t e d f l u i d K M n O 4 Long-Screen Injection Causes Large Displacement of Contaminated Water Parker, 1997
d i s p l a c e d K M n O 4 c o n t a m i n a t e d w a t e r 1 z o n e t r e a t e d b y d e n s i t y f l o w g a p 2 z o n e t r e a t e d b y d e n s i t y f l o w g a p 3 Injection of Discs Leaving Gaps Minimizes Displacement of Contaminated Water Parker, 1997
Stage 1 KMnO4 Sand aquifer Initial disc Injection of Multiple Discs Using Direct Push Device Parker, 1997
K M n O 4 Stage 2 I n j e c t i o n 1 I n j e c t i o n 2 Injection of Multiple Discs Using Direct Push Device Parker, 1997
a q u i t a r d Stage 1: Inject Disc Above DNAPL on Aquitard Stage 1 K M n O 4 sand aquifer Initial disc DNAPL Parker, 1997
Injector withdrawn Time 1 DNAPL 2 3 aquitard Disc Sinks and Spreads Parker, 1997
Case Study in Florida TCE and TCA source zone Site 22
Contamination Occurred Recentlylate 1996 to early 1997 • TCA used: 1995-96 • Switch from TCA to TCE: Nov 1996 - April 1997 • Conventional monitoring wells installed: 1997 • Fenton’s treatment pilot study: 1998-1999 • UW bundle multi-levels installed: 1999 • Fenton’s performance assessment • Permanganate selected as source removal action for permanent remedy
Site Geology Water table Fine and medium grained beach sand with no visible layering 8-inch coarse sand layer 57 ft bgs Increased frequency of gravel size carbonate rock fragments Carbonate bedrock 85 ft bgs
Monitoring Methods Focus on depth-discrete methods • Continuous Cores • Bundle tube samplers • Waterloo Profiler • Conventional Monitoring Wells • Micro-monitoring Wells
Core Being Removed from Piston Core Barrel Aluminum core tube inside core barrel
Bundle Tube Sampler STEEL WELL COVER w/CONCRETE PAD CONCRETE PAD 1/4” OD TEFLON TUBING IN 1/2” OD POLYETHYLENE TUBING 1/2” OD POLYETHYLENE or 1/4” OD TEFLON TUBING 2-4” NITEX SCREENS SET IN NATURAL FORMATION NO SAND PACK ¾” ID SCH 40 PVC PIPE CENTER STOCK 6-8” NITEX SCREEN OVER PIPE PERFORATIONS
0 100000 200000 300000 400000 500000 700000 TCE Concentration Profile CW-L 0 10 Before Injection (February 2000) 20 30 Depth (ft) 40 625,500 mg/L 50 60 70 80 600000 TCE Concentration (mg/L)
TCE Concentration Profile CW-K 0 10 Before Injection (February 2000) 20 30 Depth (ft) 40 21,574 ug/L 50 60 70 80 0 25000 5000 10000 15000 20000 TCE Concentration (mg/L)
N Monitoring well 0 1 0 f t Multilevel system GeoProbe sampling Before Remediation CW-L TCE Source Zone >10,000 µg/L Building 100 TCE Plume > 100 µg/L 100
The Waterloo Passive Approachfor Permanganate • Pre-injection delineation • Permanganate injection in targeted zones • Monitor results and design subsequent injection • Repeat steps until attain desired endpoint
Full-Scale Permanganate Remediation in Ft. Lauderdale, FL 37
Drill Rods Stage 1: KMnO4 Injection at Several Depths KMnO4 Feed Tank Scaffolding Direct Push Drill Rig Pressure Tank #2 Pressure Tank #1 NO2 Tank Asphalt Ground Surface Sand Aquifer Parker, 2000
Stage 2: Spreading and Sinking by Density KMnO4 Feed Tank Scaffolding Direct Push Drill Rig Pressure Tank #2 Pressure Tank #1 NO2 Tank Asphalt Ground Surface Sand Aquifer Parker, 2000
Conceptual Model of DNAPL Distribution Parker, 2000
Passive Crew 47
Effects of Density and Diffusion on Injected KMnO4 Ellipsoids
Project Timeline UW Site Pre-Design Characterization 3rd Injection Episode 3rd Post-Treatment Monitoring 1st Injection Episode 1st Post-Treatment Monitoring 4th Injection Episode 2nd Post-Treatment Monitoring 2nd Injection Episode 0 32 1 3 7 10 13 Time (months) February 2000 October 2002