PROBLEM SOLVING
280 likes | 302 Vues
Explore problem-solving strategies using algorithms and pseudo code in CSC 111 with examples and flowcharts.

PROBLEM SOLVING
E N D
Presentation Transcript
PROBLEM SOLVING CSC 111
Outline 1. Introduction 2. Problem Definition 3. Problem Analysis 4. Solution Design 4.1 Basic Steps 4.2 Algorithm 4.3 Flowchart 5. Examples
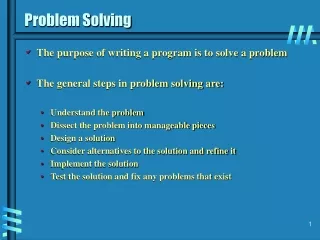
1. Introduction • The basic steps to solve a problem are: • Problem Definition: Define the main problem • Problem Analysis: • Identify the inputs • Identify the outputs • Identify the processing operations • Solution Design: • Identify the detailed steps that the computer will follow to reach the expected result
2. Problem Definition What is/are your target(s)? • Write a program that prints the sum of two numbers. • Write a program that prints the average of three numbers. • Write a program that prints the volume of a cube and the • sum of its surfaces’ areas.
3. Problem Analysis – Example 1 Identify Input, Output and Processing steps Write a program that prints the sum of two numbers • Input: 1st number (x1) Value=? entered by the user 2nd number (x2) Value=? entered by the user • Output: The summation (sum) • Processing: (Input Output) Summation = first + second sum = x1 + x2
3. Problem Analysis – Example 2 Write a program that prints the average of three numbers • Input: 1st number (x1) Value=? entered by the user 2nd number (x2) Value=? entered by the user 3rd number (x3) Value=? entered by the user • Output : The average (avg) • Processing (Input Output) Average = (first + second + third ) / 3 avg = (x1 + x2 + x3) / 3
3. Problem Analysis – Example 3 Write a program that prints the volume of a cube and the sum of its surfaces’ areas • Input: Side length (L) Value=? entered by the user • Output: The volume (V) The surface area (A) • Processing (Input Output) Volume = side * side * side V = L * L * L Surface area = ( side * side ) * 6 A = L * L * 6
4. Solution Design Problem Definition Pseudo code Problem Analysis Algorithm Solution Design Design a solution for the problem by writing an algorithm. There are two main ways that algorithms can be represented pseudo codeandflowchart. Flowchart
4.1 Solution Design – Basic Steps Read all the inputs Calculate operations Print the output
4.1 Solution Design - Algorithm An algorithm is a plan, a set of step-by-step instructions to resolve a problem.
4.1 Solution Design – pseudo code • Pseudo Code • An informal language similar to language of humans. • Is not considered programming language. • Helps programmers to write program • Does not run on computers • Should contain input, output and calculation actions • Can be easily converted for different programming languages such as Pascal, Java, C++.
4.2 Solution Design – pseudo code EXAMPLE 1 Using pseudo code to write suitable algorithm that prints the sum of two numbers Start the program 2. Read the first number and save it in the variable N1 3. Read the second number and save it in the variable N2 4. Add both numbers and save the result in the variable Sum Sum = N1 + N2 5. Print the result (Sum) 6. End the program INPUT PROCESSING OUTPUT
4.2 Solution Design – pseudo code EXAMPLE 2 Write an algorithm that prints the average of three numbers 1. Start the program 2. Read the first number and save it in the variable (num1) 3. Read the second number and save it in the variable (num2) 4. Read the third number and save it in the variable (num3) 5. Add the three numbers and save the result in the variable (sum) sum = num1 + num2 + num3 6. Divide (sum) by 3 and save the result in the variable (avg) avg= sum / 3 7. Print the result (avg) 8. End the program INPUT PROCESSING OUTPUT
4.2 Solution Design – pseudo code EXAMPLE 3 Using pseudo code to write suitable algorithm that prints the volume of a cube and the sum of its surfaces’ areas Start the program 2. Read the length of the side and save it in the variable (L) 3. Calculate the volume and save the result in the variable (V) V = L* L* L 4. Calculate the sum of surfaces’ areas and store the result in the variable (S) S = 6 * L* L 5. Print output1: the variable ( Volume ) 6. Print output2: the variable ( Surface ) 7. End the program INPUT PROCESSING OUTPUT
4.3 Solution Design – Flowchart • A flowchart is the graphical representation of the algorithm. • The flowchart illustrates the previously developed algorithm in more details. • These details make the algorithm very close to the code implementation in any high level programming language. • Worth to mention, that both algorithm and flowchart are independent of the used programming language. • The flowchart uses standard symbols to illustrate each action. These symbols are shown in the next slide.
4.3 Solution Design – Flowchart Start/End of the program Start End Read/Print the variable named n1 Read n1 Print n1 Assignment operation: the variable x is given the value 5 x= 5 Arithmetic operation: the variable N2 equals the value of n1 plus 3 N2 = n1+3 Decision: is n1 greater than 3? If True (yes) follow the left arrow. If False (no) follow the right arrow n1 > 3 True False Connector arrows: connects between symbols Connector points: marking points to sub-flowcharts 1 2 Comment: the compiler discards comments. Here my name is written as a comment // my name
4.3 Solution Design – Flowchart EXAMPLE 1 Draw a flowchart that adds two numbers Start Start the program Read the variable n1 from user Read n1 Read n2 Read the variable n2 from user Sum = n1 + n2 Add n1 to n2 and store the result in Sum Display Sum Print Sum End End Note that variables should have different names
4.3 Solution Design – Flowchart EXAMPLE 2 Using pseudo code and flowchart to write algorithmsthat print the average of three numbers Start Start the program Read the variable x1 Read x1 Read x2 Read the variable x2 Read x3 Read the variable x3 R=x1+x2+x3 Add x1, x2, x3 and store the result in R Avr=R/3 Divide R by 3 and store the result in Avr Continuation point 1 (in the next slide) 1
4.3 Solution Design – Flowchart EXAMPLE 2 (cnt’d) Continuation point 1 (from previous slide) 1 Display Avr Print Avr End End Note that variables in the Right Hand Side of any formula should have values. These are marked in blue in the flowchart. Also the variables to be printed should already have values.
4.3 Solution Design – Flowchart EXAMPLE 2 (cnt’d) This is a more simplified way of the flowchart of Example 2 Start Start the program Read the variables x1, x2, x3 Read x1, x2, x3 Divide the sum of x1, x2, x3 over 3 and store the result in Avr Avr=(x1+x2+x3)/3 Display Avr Print Avr End End
4.3 Solution Design – Flowchart EXAMPLE 3 Write an algorithm that prints the volume of a cube and the sum of its surfaces’ areas Start Start the program Read the variable L Read L V=L*L*L Calculate the volume and store in V Calculate the sum of surface areas. Store the result in S S=6*L*L Display V Print V Display S Print S End End
5. More Examples EXAMPLE 4 - ALGORITHM Write an algorithm that calculates the required tax based on the employer’s salary. If the salary is less than 5,000 SAR then tax = 10% of the salary; otherwise, the tax = 8%. • Input: Employer’s salary (salary) Value=? entered by the user • Output: The required tax (tax) • Processing (Input Output) If salary < 5000 then tax = 0.1 If salary >= 5000 then tax = 0.08
5. More Examples EXAMPLE 4 - FLOWCHART Start Start the program Read the variable salary from the user Read salary True False salary < 5000? Is salary < 5000? If salary < 5000 then tax = 0.1 tax = 0.1 If salary >= 5000, tax= 0.08 tax =0.08 Display tax Print tax End End
5. More Examples EXAMPLE 5 - ALGORITHM Write an algorithm that prints the absolute value of a number x • Input: A number (x) Value=? entered by the user • Output: The absolute value of x (|x|) • Processing (Input Output) If x >= 0 then do nothing If x < 0 then x = x * -1
5. More Examples EXAMPLE 5 - FLOWCHART Start Start the program Read the variable x from the user Read x x < 0? Is x negative? True False If x is negative then multiply x by -1. Store the new value in x x = x * -1 If x is not negative then do nothing Display x Print x End End
Flow Chart start Example : Using pseudo code and flow chart to write an algorithm. Enter number (X) and then find and print the value (Y), as shown in the following equation: Y=(X-2)/X Note: (if X=0 enter value of X again) • Pseudo code input: X process: if x=0 Re-enter the new value of x again, because you can not divide by 0 Y=(X-2)/X output: Y Input X If X=0 yes No Y=(X-2)/X Print Y End
Self-Check Exercises (1) • Using flowcharts to write suitable algorithms for the following: • Convert a temperature from ⁰C into ⁰F. • Find how many seconds are there in a number of minutes? hours? • Specify if a student passes a course or not. • Add the same number to itself n times. W2.2 Problem Solving
Self-Check Exercises (2) • Detect the faults in the following flowcharts: Start Start Start Product= x1 * x2 Read n1 Read n1 Read n2 Read n2 Read x1 Sum = n1 + n2 Diff = n1 – n2 Read x2 Print Product Print n1 Print Sum End End End FC 1 FC 2 FC 3 W1.3 Problem Solving