Download
1 / 34
340 likes | 366 Vues
GG 450 April 30, 2008. Seismic Reflection Interpretation. • Thursday Class - Presentations, Well logging, course evaluation • Tuesday Class- REVIEW ??? 2nd review ??? check previous exam link on web site • Tuesday Lab - submit your reports and do presentations

E N D
GG 450 April 30, 2008 Seismic Reflection Interpretation
• Thursday Class - Presentations, Well logging, course evaluation • Tuesday Class- REVIEW ??? 2nd review ??? check previous exam link on web site • Tuesday Lab - submit your reports and do presentations • FINAL EXAM - closed book and closed notes Thursday 15 May, 9:45AM - 11:45 POST 802
TODAY: Seismic Interpretation • How do we make geological interpretations of seismic reflection profiles? • What are the effects of various acquisition and processing steps? • What do various geological features look like?
In this example random noise has been processed to the point where “reflections (that aren’t there) are seen.
This model was used by a former student to check on a method for migration. Synthetic seismograms were generated for this model.
The synthetic data show the effects of diffraction from structures.
After migration, the diffraction hyperbolae are collapsed back to where the energy belongs with reasonable success.
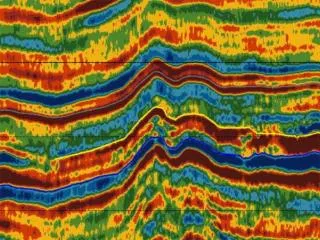
The advantages of migration are clear in this example of migration with real data. Note that the unmigrated profile is loaded with “frowns”, downward-opening hyperbolae, while the migrated section shows “smiles”, upward opening hyperbolae. The smiles form when low-velocity multiple reflections are migrated incorrectly.
Another example of the advantages of migration. In this case, the extensional faults bounding the graben are easily seen in the migrated image.
A similar section, migrated, clearly showing the faulting. Vertical exageration makes the faults appear nearly vertical. These are “growth faults” with displacement increasing with depth.
Effects of frequency. The top figure contains frequencies centered near 24 kHz - a very high frequency for reflection work. Note the extreme resolution in the shallow layers. The bottom figure contains frequencies from 2-6 kHz. While resolution is lost, penetration is considerably improved. The red line is at the same travel time in both plots.
See the strong flat reflection near the center? It isn’t caused by a bottom reflection. What do you think it might be?
Time section from off the North American east coast. The vertical axis is two-way travel time. Depth section. The vertical axis is depth. Note that the buried reef forms an antiform - a fact not obvious from the time section.
Passive margin/deltaic deposit. Can you find the multiple? How can you tell that it isn’t “real”?
With lots of data - and money - 3-D displays can be produced that correct migration in each direction, not just along a profile.
This deltaic deposit shows a deep salt layer that has deformed the layers above, possibly forming a hydrocarbon trap. What is the event history here?
3-D image of a salt diapir. Similar structures form important oil traps in several areas, such as the Gulf coast and Iran.
This profile from Germany displays loss of signal below likely gas pockets that are so highly reflective or complex that little energy gets through them.
Angular unconformaties are particularly easy to detect in reflection seismic profiles.
This is an ancient impact structure displaying pronounced central uplift. The structure when viewed as a map is essentially circular.
Faulting is also easy to detect, particularly when the throw is at least 1/4 wavelength. This is a normal fault.
The faults shown here have offsets of about half a wavelength.
Folds and faults in the Gulf of Mexico are often associated with slumping and salt tectonics.
This forarc basin (Java) shows mainly extensional tectonics. Is that what you would expect for a subduction zone?
This accretionary wedge and forarc basin show mainly compressional features. This profile in the Gulf of Mexico is similar to the one shown to us by Patrizia during lab. Her data were from near Japan. Note the bottom-simulating reflectors (BSR's); they are a strong indication of gas hydrates.
This “flowerpot” structure is typical of a cross section through a strike-slip fault.
This information-rich profile is from the Indus Fan southeast of India.
The reflector about parallel to the bottm and crossing structures is REAL. It’s a bottom-simulating reflector (BSR) caused by frozen methane hydrate “ice”.
Seismic Oceanography. Recently, seismic reflection profile data have been used to detect density changes in the ocean itself, visible by just turning up the gain. The top profile was recorded 3 days before the bottom profile.