Download
1 / 19
190 likes | 307 Vues
GG 450 April 29, 2008. Reflection Field Methods. Reflection Field Methods 1. Know your goals:

E N D
GG 450 April 29, 2008 Reflection Field Methods
Reflection Field Methods • 1. Know your goals: • What is the target depth? This is probably the most important question for definition of survey parameters. If the region is relatively unknown, a refraction survey is a good idea to establish depths and velocities. For reflection, your spread lengths should be about the same length as the target is deep. • Optimum window: A reconnaissance refraction line also allows you to choose a region of the spread where you can avoid signals that are not reflections– such as surface waves and refractions.
Geophone groups: You can also measure the velocity and wavelength of surface waves, and arrange your geophone groups to discriminate against them. Remember that surface waves are traveling along the surface with relatively low velocities, while reflections are traveling nearly vertically with relatively high apparent velocities, so that a group of geophones can be spaced so that the surface waves cancel out when the signals are added together, but the reflections will add together. Groups of 30 or more geophones in one group – resulting in ONE seismogram of a gather – are common.
Source Groups: You can also shoot your source in groups to emphasize a particular direction and discriminate against noise, adding the seismograms from all sources.
What resolution is needed? Resolution defines your spacing and dominant source frequency. • Vertical resolution:The limit of vertical resolution is roughly one wavelength/2 in shallow work. So if we want to resolve layers with thicknesses of 2 meters in material with a velocity of 800 m/s, we need wavelengths of 4 meters and frequencies of 200 Hz. Note that as velocity increases, resolution decreases for constant frequency. • Horizontal resolution: The reflection of interest comes from a region of the reflector determined by the frequency and the depth to the reflector, the Fresnel (pronounced “Fernel”) zone. This is the zone on the reflector where the reflected signal comes back to the surface in phase and adds to the energy return at the receiver.
The Fresnel zone is not predicted by ray theory – ray theory assumes that the frequency of the signal is infinite. In the table below the diameter of the region where most of the energy comes from on a reflector is given vs. wavelength and depth. These numbers are equivalent to horizontal resolution. Resolution decreases rapidly with depth as more and more area on the reflection interface is "averaged" to form the reflection signal. Resolution INCREASES as frequency increases, since a smaller area will be in phase.
The diameter of Fresnel zone in reflection seismology plotted against reflector depth and signal wavelength. Units are arbitrary.
Horizontal resolution is also defined by your shot and geophone spacing. The closer your shots and geophones, the better your resolution. BUT, if your target is deep, there's no sense in spacing shots and geophones too close because resolution is already limited by the Fresnel zone. SEISMIC SOURCE: In reflection seismology, the source used is governed by the problem - large low-frequency sources for deep penetration, high-frequency small sources for shallow targets. Oil exploration companies on land nearly always now use VIBROSEIS. Vibroseis trucks generate a long “chirp” of energy that is pushed into the ground by large hydraulic rams that lift the truck off the ground to get good coupling.
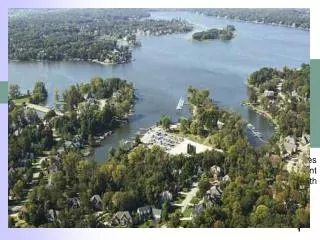
The vibroseis truck is jacked up with a hydraulic jack and a radio signal controls the vibration of the truck.
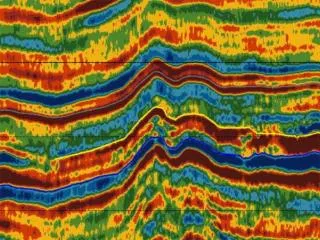
The vibroseis signal (far left), is convolved with the reflection coefficients to get a synthetic seismogram. De-convolution (convolution of the source function with the seismogram) yields an estimate of the reflection coefficients. The vibroseis result is robust in the presence of noise, as shown here. The recovered refletion coefficient signal is the final seismogram when real data are used.
Many vibroseis trucks can be used in series to make a combined source signal.
Marine Reflection source: The air gun When the air gun source array is “tuned” correctly, the source signal is close to an impulse.
Spread characteristics: The “spread” is the arrangement of the geophones that record the shots. The spread characteristics will be defined by the goals of the survey, but several options are available. Spreads are made up of geophone groups, and the geometry relative to the shot array. • Split spread: This is the one we are used for refraction, with geophones on both sides of shot points. It is good for reconnaissance surveying since refractions are also obtained. Problems: Split spread doesn't have reflection points evenly spaced, and if considerable post-processing is called for, this isn't the best method. Works fine if reflectors are high-contrast and flat.
Common-Offset: In common-offset shooting, the distance from this shot to the geophone is held constant. If the target is flat and no changes occur, then all traces recorded will be identical. Common offset is used in areas where the targets are well known and easily identified, and the goal is to detect changes in that target depths and character. Common offset should be supplemented with split spread periodically to ensure that the characteristics of the material above the target haven't changed. Very little processing is required – a good cheap way to track basement reflections.
Common Mid Point (CMP). This is the old standard for oil prospecting and evaluation. The idea is to "gather" all data that reflect from the same point below and use these data for moveout correction and stacking. While it requires considerable rearranging of traces, the principles of analysis are identical to split spread. The advantage is that in areas where depths and velocities are changing, the data being stacked all have reflections coming from near the same point on the reflectors. The disadvantage is that it can get expensive and complicated. Knowing that CMP processing will be used, field set-ups are modified to provide the best possible data.
3-D. Modern prospecting in areas of high potential now do 3-Dimensional data collection and processing. The purpose of 3-D is to provide a complete 3-dimensional model of a structure. Data are collected to provide many arrivals in each Fresnel zone below the region. All data with reflection points in each Fresnel zone are stacked and processed as in CMP. Commonly all reflections from a region about 25 m in diameter are collected into one gather. If you are shooting a region 10 km by 10 km, this is 160,000 reflection points that should have more than 20 shots reflecting inside teach reflection point. The big advantage of 3-D is that true dips and structures can be imaged. The disadvantage is COST, yet exploration for oil still remains very cheap compared to the costs of production, and any methods that will increase chances of finding an economic deposit are worth using.
4-D. Recently oil companies have become so good at imaging their production areas, that they re-shoot areas surveyed before production started to determine how much petroleum is left in the reservoir. This is done by observing the differences between the data from 3-D surveys done at different times.