Science@CSCB
Learn about chromatography, a method to identify compounds and separate mixtures. In this experiment, we will analyze colored markers to determine if they contain specific E-numbers. Discover the different types of chromatography and calculate Rf values to draw conclusions.


Science@CSCB
E N D
Presentation Transcript
Science@CSCB Introduction to Chromatography
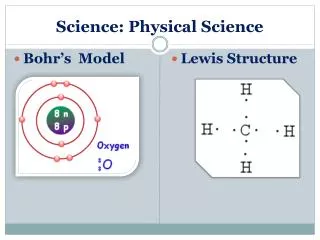
What is Chromatography? Derived from the Greek word Chroma meaning colour, chromatography provides a way to identify unknown compounds and separate mixtures
Applications of Chromatography Forensics Research Pharmaceutical industry
Types of Chromatography… Thin layer Paper HPLC Gas Column
Your mission should you choose to accept is to…….. • Analyse coloured markers • Test whether they contain E133 (blue), E122 (pink), E124 (red) or E110 (yellow)
Thin Layer Chromatography • Sample – marker • Standard – food dyes • Stationary phase – chromatography paper • Mobile phase - water
Structures of E numbers….. E122 pink E110 yellow E124 red E133 blue
So what will happen? • Each dye will travel up the paper at different speeds • The speed depends on the solubility of the dye in water and its interaction with the paper • The dyes are all different molecules with different characteristics
Calculation of results Analysis You must now calculate an Rf value for each spot. Rf = Distance from the start to the middle of a spot Distance from start to finish point of the water
Conclusions – writing up • One of the key elements of all scientific experiments is to write up your results • At the end of this experiment we would like each person to conclude from the Rf values as to which E numbers are contained in the markers