
Market Dynamics: Laws of Demand and Supply
E N D
Presentation Transcript
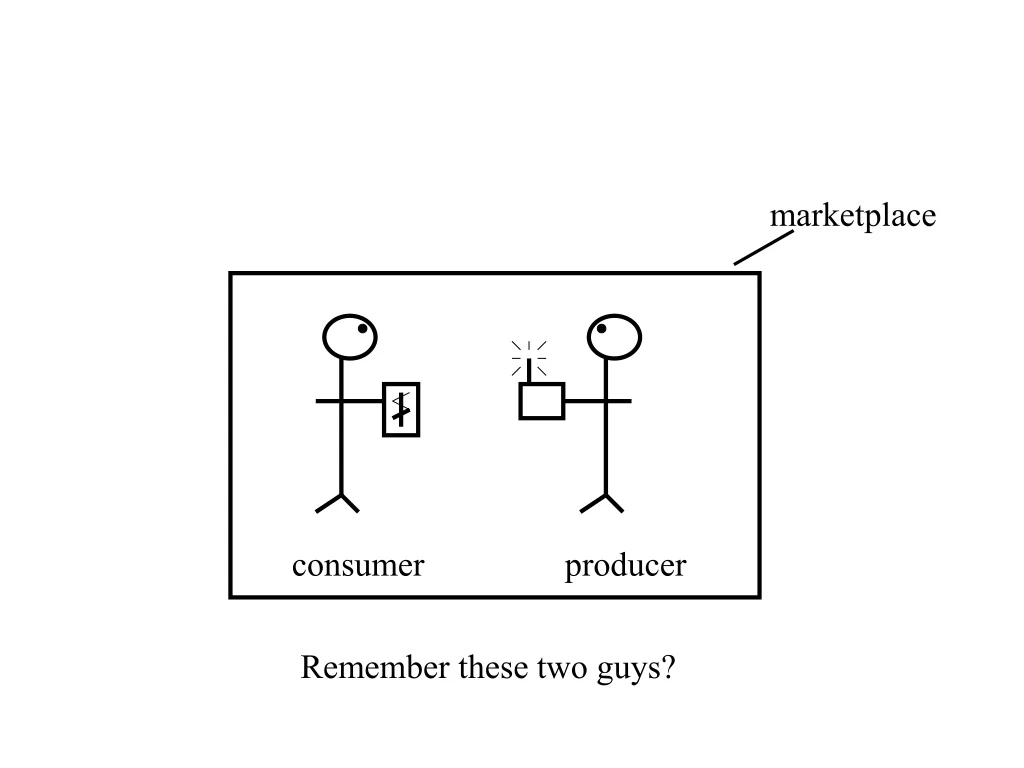
marketplace consumer producer Remember these two guys?
P Want less, higher price p1 Want more, lower price p2 D PRICE consumer QD qd1 qd2 We learned in chapter two that the consumer behaves according to the law of demand, demanding a greater quantity when prices were lower, and a lesser quantity when prices were higher. This is illustrated in the Demand Curve.
P S p1 p2 PRICE QS qs1 qs2 producer And, we learned in chapter three that the producer behaves according to the law of supply, producing a greater quantity when consumers were willing to pay higher prices, and a lesser quantity when prices were lower. This is illustrated in the Supply Curve.
Law of Demand Law of Supply P = QD P = QS consumer producer P P S p1 p1 p2 p2 D QD QS qd1 qd2 qs1 qs2
Merging the two curves into the same market, just like our stick figures reveals…(next slide) Law of Demand Law of Supply P = QD P = QS P P S D QS QD
Ch. 4 PRICE Law of Demand Law of Supply P = QS P = QD VOILA! The stick figures are replaced by a demand curve and a supply curve. They still represent the same thing, the behavior of the consumer and the producer, in the marketplace. P S D Qds Notice also how this axis on the graph becomes EITHER quantity supplied or quantity demanded, Let’s shorten the name to just to just, “Q”
At all prices above the equilibrium point, such as P1, the quantity supplied by the producer is greater than quantity demanded by the consumer. This is an economic condition referred to as a SURPLUS. Ch 4 - PRICE P D S P1 Equilibrium Point-at that price, notice how quantity demanded and quantity supplied are the same amount. Q QD1 QS1
At P2 and all prices below the equilibrium point, quantity demanded is greater than quantity supplied . This is a SHORTAGE. Ch 4 - PRICE P D S Equilibrium Point P2 Q QS2 QD2
The price at the equilibrium point shows that every consumer who wanted one of the products bought one, at what he thought was the lowest possible price AND every producer who had one for sale sold it, at what he believed was the highest possible price. No one is left standing in line for one and none are left on the shelf., therefore both consumer and producer are overjoyed. Ch 4 - PRICE P D S Equilibrium Point P3 Q Q3 QD=QS
So what happens to Price and Quantity at the equilibrium point when Demand or Supply increase or decrease? Ch 4 - PRICE P D S P1 Q Q1
When one of the determinants of demand cause demand to increase, Price and Quantity at equilibrium also increase, from P1 to P2 and from Q1 to Q2 Ch 4 - PRICE P S P2 P1 D2 D1 Q Q1 Q2
And when one of the determinants of demand cause demand to decrease, Price and Quantity at equilibrium also decrease, from P1 to P2 and from Q1 to Q2 Ch 4 - PRICE P S P1 P2 D1 D2 Q Q2 Q1
Now when one of the determinants of supply causes supply to increase, Price at equilibrium decreases and Quantity at equilibrium increases Ch 4 - PRICE P D S1 S2 P1 P2 Q Q1 Q2
And when one of the determinants of supply cause supply to decrease, Price at equilibrium increases and Quantity at equilibrium decreases Ch 4 - PRICE P D S2 S1 P2 P1 Q Q2 Q1
Ch. 4 - PRICE In Demand = Price and Quantity So, In Summary... In Demand = Price and Quantity In Supply = Price and Quantity In Supply = Price and Quantity