Download
1 / 21
300 likes | 359 Vues
Development of a geospatial framework for identifying potential PFAS source zones in the U.S., focusing on terminology, chemistry, regulation, and challenges. Explore PFAS classifications, characteristics, and detection data for effective source identification.

E N D
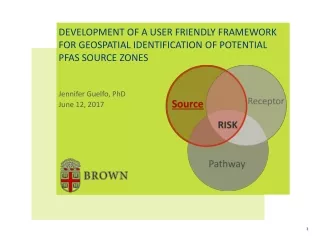
Development of a user friendly framework for geospatial identification of potential PFAS source zones Jennifer Guelfo, PhD June 12, 2017
PRESENTATION OVERVIEW Source Zone Evaluation PFAS in U.S. Drinking H2O PFAS Overview • Terminology/ chemistry • Uses/regulation • UCMR3 data • Knowledge gaps • Key PFAS sources • Geospatial eval. framework
PFAS OVERVIEW: TERMINOLOGY & STRUCTURE Perfluoroalkanesulfonates: Perfluoroalkylcarboxylates: Examples: m=3 PFBS m=5 PFHxS m=7 PFOS Examples: m=2 PFBA m=4 PFHxA m=6 PFOA Per = fully fluorinated alkyl tail.
PFAS OVERVIEW: TERMINOLOGY & STRUCTURE Perfluoroalkanesulfonates: Perfluoroalkylcarboxylates: Examples: m=3 PFBS m=5 PFHxS m=7 PFOS Examples: m=2 PFBA m=4 PFHxA m=6 PFOA Poly = partially fluorinated alkyl tail. Polyfluoroalkyl substances: m=5 6:2 FtS m=7 8:2 FtS
PFAS OVERVIEW: TERMINOLOGY & STRUCTURE Perfluoroalkanesulfonates: Perfluoroalkylcarboxylates: Examples: m=3 PFBS m=5 PFHxS m=7 PFOS Examples: m=2 PFBA m=4 PFHxA m=6 PFOA + = Per Poly Per & polyfluoro alkyl substances (PFAS) Polyfluoroalkyl substances: m=5 6:2 FtS m=7 8:2 FtS
PFAS OVERVIEW: TERMINOLOGY & STRUCTURE Buck, Robert C., et al. "Perfluoroalkyl and polyfluoroalkyl substances in the environment: terminology, classification, and origins." Integrated environmental assessment and management 7.4 (2011): 513-541.
PFAS OVERVIEW: TERMINOLOGY & STRUCTURE 3000 + new PFASs+ transformation products = relevant PFASs Buck, Robert C., et al. "Perfluoroalkyl and polyfluoroalkyl substances in the environment: terminology, classification, and origins." Integrated environmental assessment and management 7.4 (2011): 513-541.
PFAS OVERVIEW: CHEMISTRY & USES Electronegativity = strong, polar covalent bond Small size of fluorine = F shields C Resulting PFAS properties: • Strong acidity (low pKa) • Thermal stability • Chemical stability • Hydrophobic & lipophobic • Surfactant Kissa, Erik, ed. Fluorinated surfactants and repellents. Vol. 97. CRC Press, 2001. Banks, Ronald Eric, Bruce E. Smart, and J. C. Tatlow, eds. Organofluorine chemistry: principles and commercial applications. Springer Science & Business Media, 2013.
PFAS OVERVIEW: CHEMISTRY & USES Electronegativity = strong, polar covalent bond Small size of fluorine = F shields C Resulting PFAS properties: • Strong acidity (low pKa) • Thermal stability • Chemical stability • Hydrophobic & lipophobic • Surfactant Kissa, Erik, ed. Fluorinated surfactants and repellents. Vol. 97. CRC Press, 2001. Banks, Ronald Eric, Bruce E. Smart, and J. C. Tatlow, eds. Organofluorine chemistry: principles and commercial applications. Springer Science & Business Media, 2013.
PFAS OVERVIEW: REGULATION RfD * Body Wt. Relative Source Contribution Water Quality Standard = * DW ingestion Drinking Water Health Advisories for PFOA, PFOS 70 ng/L: individually or in combination • Why the differences? • VT: same RfD as EPA, different DW ingestion • NJ: different RfD based different endpoint- liver weight vs. developmental delay. Information courtesy of Dr. David Klein
PFAS IN THE U.S.: UCMR3 DATA • EPA UCMR Data 2013-2015: • 4120 Systems > 10,000 • 800 systems ≤ 10,000 • No private systems • Multiple PFAAs/sample • 4% detection rate (~200); which are ‘impacted’? • 64 systems > LHA • 122 systems > NJ (but MRL=20 ng/L) • 151 systems > VT Data reflect only samples with PFAA detections Hu, Xindi C., et al. "Detection of poly-and perfluoroalkyl substances (PFASs) in US drinking water linked to industrial sites, military fire training areas, and wastewater treatment plants." Environmental science & technology letters3.10 (2016): 344-350.
PFAS IN THE U.S.: UCMR3 DATA • EPA UCMR Data 2013-2015: • [PFAAs] 10-7000 ng/L • [PFOS] = max overall • PFOA most frequent detect • Groundwater in ~80% of detects • 2818 GW/GU systems, 2691 SW systems • Average GW [PFAA]tot > SW [PFAA]tot • Overall: GW % detect > SW % detect G = groundwater S = Surface water O = Detection rate (right axis)
PFAS IN THE U.S.: UCMR3 DATA • Is UCMR representative? • No UCMR detects in VT, including Bennington, Pownal but impacts present • Impacts present in areas not sampled (e.g. Hoosick Falls, NY) • 0.5% of small systems in U.S. sampled (Hu, 2016) • [PFAA]S > [PFAA]Lbut S = small sample size
PFAS IN THE U.S.: UCMR3 DATA Data warrant targeted screening of community, private groundwater wells; need efficient, effective design of well screening programs.
PFAS IN THE U.S.: KEY CHALLENGES • Finding sources: • Numerous uses/applications = numerous potential sources • Low target concentrations = small releases, indirect sources relevant • Unconsolidated or missing information on current, historical sources May cause: inefficient sampling plans, failure to ID all relevant sources, inability to determine source, increased time required to reduce risks to human health, environment
PFAS SOURCE ZONES: GEOSPATIAL FRAMEWORK Data Sources: Landfills Fire stations Fire Training Areas Airports Manufacturing facilities 1960-2012 • Identified industrial codes known to use or produce PFAS Hazard = (Release Prob.) * (Years of Operation)
PFAS SOURCE ZONES: GEOSPATIAL FRAMEWORK Raster Grid and Points PFAS Hazard Map City of Providence How do hazards compare to groundwater vulnerability?
PFAS SOURCE ZONES: GEOSPATIAL FRAMEWORK Vulnerability based on proximity to: Drinking water aquifers Wellhead protection areas • Hazard vs. Risk: • ↑ Hazard in pop. centers but… • GW not classified for drinking • ↑ Risk in rural areas for small, community scale systems GW Recharge Risk = Hazard * Vulnerability
PFAS SOURCE ZONES: GEOSPATIAL FRAMEWORK • Geospatial future work: • Assist in sample point selection, sampling, analysis • Ground truth geospatial analysis • Pending source data availability, implement in regions w/GW data • Key questions: • Can we evaluate based on potential for release vs. known use/release? • Relative importance of location info for each source type Buffered community wells Wells = exposure potential
Brown University Superfund Research Program • Dr. Scott Frickel • Thomas Marlow • Amy Parmenter, RIDOH • Dr. Eric Suuberg • Suuberg lab group