Download
1 / 10
100 likes | 278 Vues
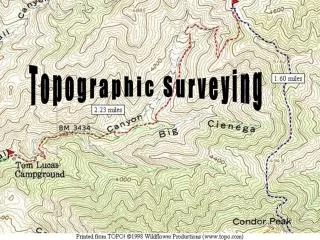
T o p o g r a p h i c M a p s. By Megan and Slad e. What is a topographic map?. A topographic map is a map that shoes the surface features, or topography, of the Earth.

E N D
TopographicMaps By Megan and Slade
What is a topographic map? • A topographic map is a map that shoes the surface features, or topography, of the Earth. • Topographic maps show both natural features, such as rivers , lakes, and mountains, and features made by humans, such as cities, roads, ad bridges.
Elevation • Topographic maps also show elevation • Elevation is the height of an object above sea level. • A federal government agency, USGS, has made topographic maps for all the surfaces in the US. • Each map is a detailed description of a small area on the Earth’s surface. • They use feet as their units of measure.
Contour lines • Contour lines are used to show elevation. • Contour lines are lines that connect points at equal elevation. • The shape of the contour lines reflects the shape of the land.
Contour interval • A contour interval is the difference in elevation between one contour line to the next. • For example, a map with a contour interval of 20 ft. would have contour lines every 20 ft, of elevation change, such as 0 ft., 20 ft., 40 ft., 60 ft., and so on.
Relief • Relief is the difference in elevation between the highest of lowest points of an area being mapped. • For example, the closer the lines, the higher the relief, the further the lines, the lower the relief.
Index contour • An index contour is a darker, heavier contour line that is usually every fifth line and that is labeled by elevation. • It is used to make reading the map a little easier.
Reading a topographic map • Topographic maps, like other maps, use symbols to represent parts of the Earth’s surface. • Different colors are also used to represent different features of the earths surface. • Buildings, roads, bridges, and railroads are black. • Contour lines are brown. • Major highways are red. • Cities and towns are pink. • Bodies of water are blue. • Wooded areas are green.
Golden rule of contour lines • When you first read a topographic map it may seem confusing. • But knowing the following rules will help you understand topographic maps. • Contour lines never cross. • The darkening of contour lines depends on slop and elevation. • Contour lines that are part of a valley or stream are v shaped. • Closed circles indicate a hill , plataou, or depression.
Summary • A topographic map, is a map that shows the layout of the land. • Elevation is the height of something above sea level. • Contour lines are used to show elevation. • Contour interval is the amount of elevation between one contour line to the next. • An index contour is a darker heavier line every 5 to 10 lines to show elevation.