Download
1 / 30
300 likes | 530 Vues
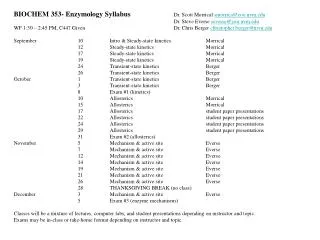
BIOCHEM 353- Enzymology Syllabus Dr. Scott Morrical smorrica@zoo.uvm.edu Dr. Steve Everse severse@zoo.uvm.edu WF 1:30 – 2:45 PM, C447 Given Dr. Chris Berger christopher.berger@uvm.edu September 10 Intro & Steady-state kinetics Morrical 12 Steady-state kinetics Morrical

E N D
BIOCHEM 353- Enzymology Syllabus Dr. Scott Morrical smorrica@zoo.uvm.edu • Dr. Steve Everse severse@zoo.uvm.edu • WF 1:30 – 2:45 PM, C447 Given Dr. Chris Berger christopher.berger@uvm.edu • September 10 Intro & Steady-state kinetics Morrical • 12 Steady-state kinetics Morrical • 17 Steady-state kinetics Morrical • 19 Steady-state kinetics Morrical • 24 Transient-state kinetics Berger • 26 Transient-state kinetics Berger • October 1 Transient-state kinetics Berger • 3 Transient-state kinetics Berger • 8 Exam #1 (kinetics) • 10 Allosterics Morrical • 15 Allosterics Morrical • 17 Allosterics student paper presentations • 22 Allosterics student paper presentations • 24 Allosterics student paper presentations • 29 Allosterics student paper presentations • 31 Exam #2 (allosterics) • November 5 Mechanism & active site Everse • 7 Mechanism & active site Everse • 12 Mechanism & active site Everse • 14 Mechanism & active site Everse • 19 Mechanism & active site Everse • 21 Mechanism & active site Everse • 26 Mechanism & active site Everse • 28 THANKSGIVING BREAK (no class) • December 3 Mechanism & active site Everse • 5 Exam #3 (enzyme mechanisms) • Classes will be a mixture of lectures, computer labs, and student presentations depending on instructor and topic. • Exams may be in-class or take-home format depending on instructor and topic.
On-Line References for Steady-State Enzyme Kinetics Dr. Peter Birch, University of Paisley http://www-biol.paisley.ac.uk/kinetics/contents.html University of Texas http://www.cm.utexas.edu/academic/courses/Fall2001/CH369/LEC05/Lec5.htm Terre Haute Medical College http://web.indstate.edu:80/thcme/mwking/enzyme-kinetics.html
Enzymes-- Biological Catalysts Catalyst- a substance that increases the rate of a reaction without itself being changed or consumed in the overall process Turnover- the catalyst may be reused in subsequent reactions
X* transition state Free energy of activation DG* reactants Free Energy DGo products Free energy change Reaction Progress uncatalyzed catalyzed reactants Free Energy products Reaction Progress Chemical Kinetics & Equilibria: The position of equilibrium is determined by the free energy change, DGo DGo = -RTlnKo The rate of a reaction depends on the free energy of activation, DG* Catalysts: Speed up reactions by lowering the free energy of activation, DG* Do not affect the position of equilibrium (DGo unchanged)
Why do we need enzymes? • * A chemical reaction occurs only if the molecules possess a minimum amount of energy---Activation Energy • * Chemical reactions require initial input of energy--usually in the form of increased heat • * Raising the temperature increases the rate of (vibrational, translational) movement of the molecules and the chance of collision • * An increase in the concentration of reactants can also increase the chances of a chemical reaction occurring • * HEAT and MORE REACTANTS can increase chance of chemical reaction occurring • * Biological systems cannot raise heat or concentrations at will
How do enzymes do that? * Provide alternate pathway by lowering energy of activation, stabilization of transition state--same as adding heat * Lowers activation energy, but does not change free energy required for the reaction to occur (alters the rate, but not thermodynamics) * Provide a surface for the reaction to occur, bringing reactants into close proximity to each other--functional equivalent of increasing concentration
Enzyme catalysts contain unique active sites---where the substrates bind and the reaction takes place * Lock and key model--substrate fits exactly into active site * Induced fit model--substrate causes change in enzyme's active site shape to make substrate fit Once bound, the substrate reaches the transition state and bonds are rearranged. The enzyme active site: * Places atoms in close proximity to each other * Orients substrate correctly * These two effects facilitate the breaking and reforming of bonds
Enzyme-Substrate Binding Specificity Lock & Key Induced Fit
Classes of enzymes * Oxidoreductases--oxidation/reduction; requires a co-factor such as NAD or FAD A: + B => A + B: * Transferases--transfer of a functional group A-B + C => A + B-C * Hydrolases--hydrolysis of functional group by water A-B + H20 => A-H + B-OH * Lyases--elimination to form double bond; or addition to a double bond X-A-B-Y => A=B + X-Y * Isomerases--isometric interconversions X-A-B-Y => Y-A-B-X * Ligases--ATP dependent joining of two molecules A + B +ATP => A-B + ADP + Pi
Enzymes: Compilations of Databases & Online Resources http://restools.sdsc.edu/biotools/biotools12.html FRONTIERS IN BIOSCIENCES http://www.bioscience.org/urllists/protdb.htm ExPASy Molecular Biology Server http://us.expasy.org/
Enzyme Kinetics: Studies of the rate or velocity of enzyme-catalyzed reactions, and factors influencing these rates. Mathematical analyses of the relationships between substrate (or inhibitor, activator) concentrations and reactions rates yield: -- characteristic properties of enzymes or classes of enzymes -- insights into enzyme mechanisms and physiology
The Effects of Substrate Concentration on Reaction Rate S = substrate P = product E = enzyme E S P Uncatalyzed Reaction: At a fixed concentration of enzyme, the velocity reachs a maximum, which fits the equation of a rectangular hyperbolic curve: y=(ax)/(b + x) v [S] Velocity v = d[P]/dt = -d[S]/dt
Michaelis-Menton Equation For enzyme-catalyzed reaction E + S ES E + P v = V[S] / (Km + [S]) (rectangular hyperbola) They made the following assumptions: * [E] is always much less than [S] * formation of [ES] is required to obtain [P] * therefore, at high [S], all the [E] will be saturated and the reaction cannot proceed any faster by adding more [S], this velocity is V or Vmax (“a” in general equation for hyperbolic curve) * velocity of reaction as a function of [S] is only dependent on dissociation of [ES] into [E] and [S]. The equilibrium constant, Km, is "b" in the equation for a hyperbolic curve When v= Vmax/2 (the velocity at 1/2 maximal velocity), then [S] = Km Km is called the Michaelis constant
k1 k2 E + S ES E + P k-1 Steady-State Derivation of Michaelis-Menton Equation (Briggs & Haldane) Upon mixing of enzyme and substrate [ES] rises rapidly and reaches a steady state, where the rate of formation and breakdown of [ES] are equal, i.e. v1= k1 [E][S] and v2= k-1 [ES] + k2[ES] so that at steady state v1 = v2 Free enzyme conc. [E]= [Et] -[ES]; note that [E] cannot be measured, but [Et] is known, as is [S] since initial velocities, and [P] can be measured. Now solve for the unknown [ES]. v1= k1 ([Et] -[ ES])[S] = v2 = k-1[ES] + k2[ES] rearrange ([Et] -[ES])[S]/[ES] = k-1+ k2 /k1 = Km Solving for [ES] gives [ES] = [Et][S]/ Km + [S] the velocity (v) of the reaction will be proportional to the formation of [ES], so v= k2 [ES] (substitute in the value for ES in red above) to get: v=k2 [[Et][S]/ Km + [S] ] and at saturating [S], Vmax = k2[Et] (substitute Vmax for the k2 [[Et] in the above equation), then v= Vmax [S]/ Km + [S] which is the same as the Michaelis-Menton equation time Note importance of initial velocities (vo)
The Effects of Enzyme Concentration Vmax is directly proportional to enzyme concentration At saturating substrate ([S] >> Km): Km is independent of enzyme concentration
Measuring Kinetic Parameters: Graphical & Computational Methods * Lineweaver-Burk Plot * Eadie-Hofstee Plot * Hanes Plot * Direct Linear Plot * Direct Fitting of v vs. [S] Curve * Single Progress Curve * Statistics
Lineweaver-Burk Plot: Rearrangement of Michaelis-Menten equation to linear form 1/v = (Km/V)(1/[S]) + 1/V Plot for hypothetical enzyme with: V = 10 Km = 4
Disadvantages of Lineweaver-Burk Plot Still working with hypothetical enzyme with V = 10, Km = 4… 1/v = (Km/V)(1/[S]) + 1/V …only here random error has been introduced into multiple data sets, and results plotted to illustrate how greatly estimates of Km and V can vary from plot to plot depending on data quality. How to improve: --averaging --weighting --choose another method
Eadie-Hofstee Plot: Rearrangement of Michaelis-Menten equation to another linear form v = -Km(v/[S]) + V Same hypothetical enzyme with: V = 10 Km = 4
Disadvantages of Eadie-Hofstee Plot Still working with hypothetical enzyme with V = 10, Km = 4 v = -Km(v/[S]) + V Once again random error has been introduced to demonstrate the scatter which can skew estimates of Km and V; almost as bad as Lineweaver-Burk plot. Another problem: Both axes are functions of the dependent variable (v)
Hanes Plot: Rearrangement of Michaelis-Menten equation to still another linear form [S]/v = (1/V)[S] + Km/V Same hypothetical enzyme with: V = 10 Km = 4
Error Issues in the Hanes Plot Still working with hypothetical enzyme with V = 10, Km = 4 [S]/v = (1/V)[S] + Km/V Once again random error has been introduced… generally scatter is improved relative to LH and EH plots, which can improve the accuracy of Km and Vestimates. Avoids the other problem of EH plots in that dependent variable (v) does not influence the idependent (horizontal) axis.
Direct Linear Plot Here, using two data points (w/o error) from same hypothetical enzyme with V = 10 and Km = 4 For both ([S], v) data points, plot -[S] on horizontal axis and v on vertical axis, then draw a line connecting the two values. The lines intersect at coordinates (Km, V) allowing direct read-out of these parameters.
Direct Linear Plot Here is the same type of plot only with lines drawn for all 10 of the error-free ([S], v) data points from our hypothetical enzyme with V = 10 and Km = 4 Since there is no error, all of the lines intersect at a common point with coordinates (Km, V). V Km
Effects of Error on Direct Linear Plot Now looking at 5 ([S], v) points from a data set including random error, again from our hypothetical enzyme with V = 10 and Km = 4. Lines no longer intersect at a common point, thereby giving a large range of values for Km and V from all of the different intersection points. In fact, the number of intersections is given by the simple equation: n(n-1)/2, where n = the number of lines. Statistically, the best way to deal with this is to take the median (not the mean) values of Km and V, which minimizes the contributions of spurious outliers (such outliers could badly skew the mean values). See Birch’s website for a good description of this approach.
Theory Behind Direct Linear Plot Yet another linear rearrangement of the Michaelis-Menten equation: V = (v/[S])Km + v …would give a straight line if “constants” V and Km plotted against each other; slope and intercept would be “variables” v/[S] and v, respectively. * In fact, lines in Direct Linear Plot represent infinite number of values of Km and V which satisfy the Michaelis-Menten equation for a given ([S], v) data pair. * But the intersection of two lines generated from two different ([S], v) data pairs gives the unique values of Km and V that satisfy both conditions, so these must be the true ones (subject to experimental error of course).
Direct Fitting of v vs. [S] Curves A number of commercially available non-linear regression packages exist which will perform global fits of the hyperbolic form of the Michaelis-Menten equation to experimental data. -- Enzfit, Kaleidograph, etc. -- Outputs usually consist of Km and V parameters with statistical arguments such as variance and other indicators of goodness-of-fit. -- CAUTION: Always compare fitting results with standard graphical methods of analysis. Be aware that different statistical packages can skew Km and V values depending on how data is weighted and how outliers are treated. U. Paisley Website Includes Instructions For Setting Up a Global Fitting Routine for Michaelis-Menten Enzyme Kinetics Data in Microsoft Excel http://www-biol.paisley.ac.uk/kinetics/Chapter_2/contents-chap2.html
Statistical Weighting of Enzyme Kinetics Data The utility of some methods, such as the Lineweaver-Burk Plot, can be improved through the use of statistical weighting methods. -- Error is usually greatest in reaction velocities measured at low substrate concentrations (slow reactions) -- Therefore you can give the higher-velocity data (containing less error) more weight in, say, fitting a straight line to a Lineweaver-Burk Plot by linear regression. -- The correct weighting factor is v4, which is the reciprocal of the variance. References: Cleland (1967) Adv. Enzymol. 29, 1-32. Wilkinson (1961) Biochem. J. 80, 324-332. Magar (1972) Data Analysis in Biochemistry And Biophysics, Academic Press, New York, pp. 429-432. Atkinson et al. (1961) Biochem. J. 80, 318-323. Barnes & Waring (1980) Pocket Programmable Calculators in Biochemistry, John Wiley & Sons, New York, pp. 204-235. unweighted weighted 1/v 1/[S]
Km and V From a Single Progress Curve Substrate concentration is monitored throughout a reaction timecourse; At any given time (substrate conc.), the instantaneous velocity is determined from the slope of the curve’s tangent line. ([S], v) data pairs so generated are analyzed via any of the methods already discussed. Pitfalls (there are many): -- not based on initial velocities. -- product inhibition. -- noise affects slope. -- enzyme and/or substrate lability. -- more susceptible to changes in pH, ions, etc.
Siesta Time!