Download
1 / 78
790 likes | 1.14k Vues
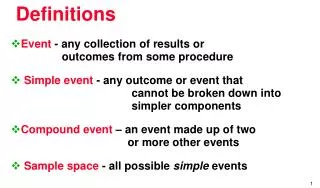
Event - any collection of results or outcomes from some procedure Simple event - any outcome or event that cannot be broken down into simpler components

E N D
Event - any collection of results or outcomes from some procedure Simple event - any outcome or event that cannot be broken down into simpler components Compound event – an event made up of two or more other events Sample space - all possible simple events Definitions
P - denotes a probability A, B, ...- denote specific events P (E)- denotes the probability of event E occurring Notation
Rule 1: Relative Frequency Approximation Conduct (or observe) an experiment a large number of times, and count the number of times event E actually occurs, then an estimate of P(E) is Basic Rules for Computing Probability
Rule 1: Relative Frequency Approximation Conduct (or observe) an experiment a large number of times, and count the number of times event A actually occurs, then an estimate of P(E) is Basic Rules for Computing Probability P(E) = Number of times E occurred Total number of possible outcomes
Rule 2: Classical approach (requires equally likely outcomes) If a procedure has n different simple events, each with an equal chance of occurring, and s is the number of ways event E can occur, then Basic Rules for Computing Probability
Rule 2: Classical approach (requires equally likely outcomes) If a procedure has n different simple events, each with an equal chance of occurring, and s is the number of ways event E can occur, then Basic Rules for Computing Probability s P(E) = number of ways E can occur = n number of different simple events
Rule 3: Subjective Probabilities P(E), the probability of E, is found by simply guessing or estimating its value based on knowledge of the relevant circumstances. Basic Rules for Computing Probability
Rule 2 The classical approach is the actual probability. Rule 1 The relative frequency approach is an approximation.
As a procedure is repeated again and again, the relative frequency probability (from Rule 1) of an event tends to approach the actual probability. Law of Large Numbers
Law of Large Numbers Flip a coin 20 times and record the number of heads after each trial. In L1 list the numbers 1-20, in L2 record the number of heads. In L3, divide L2 by L1. Get a scatter plot with L1 and L3. What can you conclude?
The sample space consists of two simple events: the person is struck by lightning or is not. Because these simple events are not equally likely, we can use the relative frequency approximation (Rule 1) or subjectively estimate the probability (Rule 3). Using Rule 1, we can research past events to determine that in a recent year 377 people were struck by lightning in the US, which has a population of about 274,037,295. Therefore, P(struck by lightning in a year) 377 / 274,037,295 1/727,000 Example:Find the probability that a randomly selected person will be struck by lightning this year.
There are 5 possible outcomes or answers, and there are 4 ways to answer incorrectly. Random guessing implies that the outcomes in the sample space are equally likely, so we apply the classical approach (Rule 2) to get: P(wrong answer) = 4 / 5 = 0.8 Example:On an ACT or SAT test, a typical multiple-choice question has 5 possible answers. If you make a random guess on one such question, what is the probability that your response is wrong?
The probability of an impossible event is 0. The probability of an event that is certain to occur is 1. Probability Limits
The probability of an impossible event is 0. The probability of an event that is certain to occur is 1. 0 P(A) 1 Probability Limits
The probability of an impossible event is 0. The probability of an event that is certain to occur is 1. 0 P(A) 1 Probability Limits Impossible to occur Certain to occur
Possible Values for Probabilities Certain 1 Likely 0.5 50-50 Chance Unlikely Impossible 0
The complement of event E, denoted by Ec, consists of all outcomes in which event E does not occur. Complementary Events
The complement of event E, denoted by Ec, consists of all outcomes in which event E does not occur. P(E) Complementary Events P(EC) (read “not E”)
Example: Testing CorvettesThe General Motors Corporation wants to conduct a test of a new model of Corvette. A pool of 50 drivers has been recruited, 20 or whom are men. When the first person is selected from this pool, what is the probability of not getting a male driver?
Because 20 of the 50 subjects are men, it follows that 30 of the 50 subjects are women so, P(not selecting a man) = P(man)c = P(woman) = 30 = 0.6 50 Example: Testing CorvettesThe General Motors Corporation wants to conduct a test of a new model of Corvette. A pool of 50 drivers has been recruited, 20 or whom are men. When the first person is selected from this pool, what is the probability of not getting a male driver?
Flipping a coin is an experiment and the possible outcomes are heads (H) or tails (T). One way to picture the outcomes of an experiment is to draw a tree diagram. Each outcome is shown on a separate branch. For example, the outcomes of flipping a coin are Using a Tree Diagram H T
A Tree Diagram for Tossing a Coin Twice There are 4 possible outcomes when tossing a coin twice. First Toss Second Toss Outcomes H HH H T HT H TH T T TT
Rules of Complementary Events P(A) + P(A)c = 1
Rules of Complementary Events P(A) + P(A)c = 1 = 1 - P(A) P(A)c
(1,1) (1,2) (1,3) (1,4) (1,5) (1,6) (2,1) (2,2) (2,3) (2,4) (2,5) (2,6) (3,1) (3,2) (3,3) (3,4) (3,5) (3,6) (4,1) (4,2) (4,3) (4,4) (4,5) (4,6) (5,1) (5,2) (5,3) (5,4) (5,5) (5,6) (6,1) (6,2) (6,3) (6,4) (6,5) (6,6) Possible outcomes for two rolls of a die
Find the following probabilities • 1/36 • 2/36 • 3/36 • 4/36 • 5/36 • 6/36 • 5/36 • 4/26 • 3/36 • 2/36 • 1/36 • Find the probability that the sum is a 2 • Find the probability that the sum is a 3 • Find the probability that the sum is a 4 • Find the probability that the sum is a 5 • Find the probability that the sum is a 6 • Find the probability that the sum is a 7 • Find the probability that the sum is a 8 • Find the probability that the sum is a 9 • Find the probability that the sum is a 10 • Find the probability that the sum is a 11 • Find the probability that the sum is a 12
give the exact fraction or decimal or Rounding Off Probabilities
give the exact fraction or decimal or Rounding Off Probabilities • round off the final result to three significantdigits
How many ways are there to answer a two question test when the first question is a true-false question and the second question is a multiple choice question with five possible answers? Tree Diagram of Test Answers
Tree Diagram of Test Answers a b c d e a b c d e Ta Tb Tc Td Te Fa Fb Fc Fd Fe T F
What is the probability that the first question is true and the second question is c? Tree Diagram of Test Answers
Tree Diagram of Test Answers a b c d e a b c d e Ta Tb Tc Td Te Fa Fb Fc Fd Fe T F
1 2 FIGURE 3-9 Tree Diagram of Test Answers a b c d e a b c d e Ta Tb Tc Td Te Fa Fb Fc Fd Fe T F P(T) =
1 1 5 2 Tree Diagram of Test Answers Ta Tb Tc Td Te Fa Fb Fc Fd Fe a b c d e a b c d e T F P(T) = P(c) =
1 1 1 5 2 10 FIGURE 3-9 Tree Diagram of Test Answers a b c d e a b c d e Ta Tb Tc Td Te Fa Fb Fc Fd Fe T F P(T) = P(c) = P(T and c) =
Rock – Paper – Scissors Tree Diagram- 2 Players T BA A T B BA T
AB B B B C B C B B B C BAB C B BB C B C B B B B A
Pg 189 #9 1/16 5/8 13/14 1/3 3/4 1/3
Compound Event Any event combining 2 or more simple events Definition
Notation P(A or B) = P (event A occurs or event B occurs or they both occur) Definition
General Rule When finding the probability that event A occurs or event B occurs, find the total number of ways A can occur and the number of ways B can occur, but find the total in such a way that no outcome is counted more than once. Compound Event
Formal Addition Rule P(A or B) = P(A) + P(B) - P(A and B) where P(A and B) denotes the probability that A and Bboth occur at the same time. Compound Event
Events A and B are mutually exclusive if they cannot occur simultaneously. Definition
Total Area = 1 Total Area = 1 P(A) P(B) P(A) P(B) P(A and B) Overlapping Events Non-overlapping Events Venn Diagrams