Effective Spreadsheet Design and Lab Assignments Overview
This document outlines key lab assignments, including deadlines and grading criteria, as well as effective spreadsheet design guidelines. Lab 1 will be graded soon, and students can earn partial credit by addressing noted issues. Lab 2 instructions are available on D2L; all work must be submitted by September 11th. Learning objectives include understanding spreadsheet design principles, conditional formatting, and the use of symbolic naming. Practical examples illustrate these concepts, emphasizing clarity, organization, and effective data presentation for planning and analysis.


Effective Spreadsheet Design and Lab Assignments Overview
E N D
Presentation Transcript
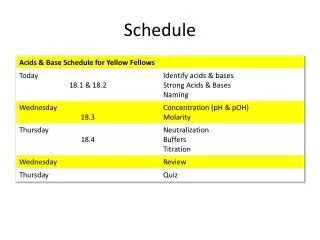
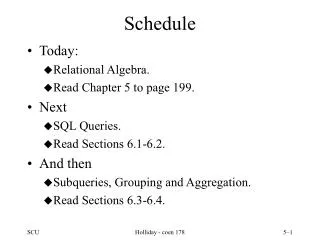
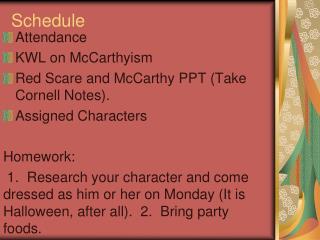
Schedule • Lab 1 – Notes • Lab 2 – Due Sept. 11th • Chapter 14 • Wednesday: • Additional Excel/Google Docs Notes • Friday: • Test 1 (Ch 1,2,3,9,13,14)
Lab 1 • Lab 1 has been graded • If you lost any points on the lab, there should be notes attached to the grade • If you fix the issues noted before class on the 11th, you will receive partial credit. • For example, if you lost 1 point for not sharing the form/spreadsheet with me, and you complete this by the 11th, you will receive 0.5 points • Also, if you did not turn in your lab yet, you can still turn it in late for partial credit
Lab 2 • The lab instructions are posted on D2L • You have until the end of class on the 11th to turn in your complete spreadsheet via the dropbox in D2L
Learning Objectives • State the two basic design criteria for creating effective spreadsheets • Explain how conditional formatting of spreadsheet entries applies an interpretation to spreadsheet information • Use AutoFiltering and advanced filtering to customize spreadsheet lists • Explain the importance of symbolic naming of spreadsheet cells
Designing a Spreadsheet • When we make a spreadsheet to find an answer and then delete it, all that matters is that the computation was right • When a spreadsheet is used repeatedly, it becomes a tool of planning, analysis, and decision-making • To be effective, a spreadsheet must be well designed, informative, and flexible
Design Guidelines • Two basic principles for setting up effective spreadsheets: • Focus on Form: Make the form logical, the layout clean, and the entries clear and easy to use • ExplainEverything: It should be possible to know immediately what every cell means
Focus on Form • A spreadsheet is used in solving problems • It must be easy to understand and easy to work with • Arrange the data logically: • Descriptive information should be on the top and left sides • Summary information should be on the bottom and right sides
Focus on Form • Fonts should be clear • Colors should be used in moderation • Be an attraction, not a distraction • Use a separate sheet for each table • Individual sheets make working with multiple tables more manageable • Hiding information that isn’t needed is also a good way to make a spreadsheet clear and easy to use
Explain Everything • Include meaningful column headings and identifying information about the rows • Cells and ranges are assigned symbolic names so the content becomes meaningful • For summary information cells, choose modifiers like total and largest • For computations, include comments to explain assumptions made when creating the formulas
The Trip Sample Spreadsheet • Scenario: • Two friends wonder if it’s possible to drive to the Arctic Circle from Chicago. • The trip to Inuvik is 3,663 miles from home and will take three days and eight hours of driving time. • The given driving time is continuous, which they do not plan to do. • Use a spreadsheet to figure out how long it will take and how much it will cost.
Applying the Rules • The trip is a five-day trek from Chicago to Dawson, Yukon Territory • From Dawson, they will drive to the Arctic Circle and back to Dawson that night
Applying the Rules • Friends will be included to offset costs • The friends are interested in how much the trip will cost • Part of the trip is through the United States where gas is priced by the gallon in US $ • Part of the trip is through Canada where petrol is priced by the liter in Canadian $
Applying the Rules • The spreadsheet has a title listing the authors and stating the completion date • Columns are assigned clear headings • The heading row is filled with a soft color that separates it from the content • A clean, sans serif font presents the data justified in the cells
Applying the Rules • Comments or “Sticky notes”: • Cells with comments have a red triangle in the cell’s upper right corner • Hovering the cursor over the cell displays the comment • To insert a comment in Excel, select the cell and then navigate Insert > New Comment • To edit it, select the cell and navigate Insert > Edit Comment • To remove a comment, navigate Edit > Clear > Comments
Applying the Rules Comments
Conditional Formatting • Cell Value Is • This window lets users specify one or more conditions • If the program finds that these conditions apply to the cell, it formats the entry in the manner specified • Users specify the condition by picking one of a set of relationships and filling in the limits
Conditional Formatting • Formula Is • It’s possible to format items based on a formula • Using Formula Isallows for acomparison with a cell other than the one being
Defining Names • It can be helpful when designing a spread-sheet to give names to components of the sheets • A name is a word or phrase assigned to a cell or range of cells • Once the name has been assigned, it can be used wherever cell references would be used
Defining Names • Using names reduces the chance of messing up range specifications • Errors are minimized when columns and rows are added/deleted • Choose Insert > Name > Define . . . and enter a name • The software assigns the name to that range
Defining Names • Now, choose Insert > Name > Apply toallow the use of the name
Analyzing Data Using Filtering • Use of the Filtering tool allows access to subsets of information held in a spreadsheet • Filtering selects only certain rows from a list • It applies only to spreadsheet tables that have column headings • Filtering lets users create a customized version of a spreadsheet list that is limited to the rows meeting some criterion
Analyzing Data Using Filtering • AutoFilter • Select any cell in the list • Choose Data > Filter > AutoFilter • The result is a redrawn spreadsheet list with triangle menu buttons by each column heading • The menu buttons give you options for filtering the list based on data in that column
Analyzing Data Using Filtering • AutoFilter • Clicking a button opens the menu and presents the options: • include sorting rows • displaying rows containing a limited number of values • displaying only those rows matching a specific value in the column
Advanced Filtering Setup • To apply advanced filtering, provide a column name and a filtering criterion: • First, add a new columnGive the new column the same heading as the column containing the data to be filtered • Second, in the cell below the heading, enter criterion to indicate that values in the other column by the same name should be filtered for that criterion
Executing an Advanced Filter • To run the actual filtering operation, select a cell in the column to be filtered • Next, choose Data > Filter > Advanced Filter. . . , which displays the Advanced Filter window
Executing an Advanced Filter • The List range gives the dimensions of the list that is going to be filtered • The Criteria range is where users specify the setup column • Enter the range covering the heading and the criterion • Clicking OK produces a filtered table
Executing an Advanced Filter • To restore the original table, choose Data > Filter > Show All • The Copy to option in the Advanced Filter window specifies a new place on the spreadsheet to place the filtered result • It can be handy to have both the original and filtered result to compare
Filtering on Multiple Criteria • The Advanced Filtering feature allows multiple criteria • These criteria are specified during setup by defining multiple columns • During execution the Criteria range is enlarged to cover all criteria • Filtering is extremely useful
Summary • This chapter has taught several advanced spreadsheet techniques. • You learned the following: • Two basic principles underline the design of effective spreadsheets:(1) focus on form and (2) explain everything. • Conditional formatting can apply an interpretation to the data in a spreadsheet so that it is easy to perceive.
Summary • This chapter has taught several advanced spreadsheet techniques. • You learned the following: • Conditional formulas using the IF( ) function allow complex, case-specific data definition and analysis. • Naming the cells and regions of a spreadsheet allows the parts of a spreadsheet to be referenced in a convenient and less error-prone way.
Summary • This chapter has taught several advanced spreadsheet techniques. • You learned the following: • “What if” analysis is a particularly powerful application of spreadsheets in which the consequences of alternative information can be assessed. • Filtering effectively customizes spreadsheet data to particular cases.