Download
1 / 10
140 likes | 332 Vues
Breast Cancer Classification Using ANN. Ross Nordstrom Intro to Artificial Neural Networks Yu Hen Hu December 14, 2010. Overview. Learning Methods K-Nearest Neighbor Maximum Likelihood (using negative log) Training Methods Leave One Out

E N D
Breast Cancer Classification Using ANN Ross Nordstrom Intro to Artificial Neural Networks Yu Hen Hu December 14, 2010
Overview • Learning Methods • K-Nearest Neighbor • Maximum Likelihood (using negative log) • Training Methods • Leave One Out • Random grouping over ~5%-95% of data set used for training • Used 10+ different sets for each ratio
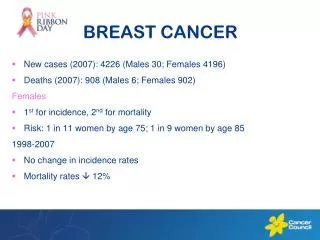
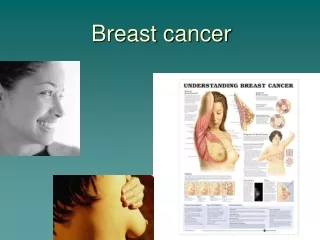
About • ~Leading Global Cause of Death in Women[1] • ~1.302M cases • ~460K deaths • ~30% in developed • ~45% in 3rd world • ~ Treatment based on the stage of the cancer • ~Not easily detectable. Early signs may be hidden or attributed to hormones • ~Mammograms detect 85-90% • Existing Approaches • Basic • ~ 97.5% [2] - 1 separating plane in 3D space of worst area/smoothness • * Has correctly diagnosed 176 consecutive new patients • Diagnosis • ~95.6%[4] - Parallel hyper planes • ~93.7%[4] - 1 nearest neighbor • Prognosis • ~ 86.3%[2] - Multisurface Method-Tree in 4D space
Maximum Likelihood Leave-One-Out Training
Maximum Likelihood • Randomly Distributed Training Set (2%-98%) Peak : 100% Best avg: 91% Avg: 89% Peak : 100% Best avg: 91% Avg: 86% Peak : 100% Best avg: 80% Avg: 64%
K-Nearest Neighbor Leave-One-Out Training 1-15 Neighbors Basic DiagProg Mean: 81% 86% 68% Median: 80% 87% 69% Std: 2.25 3.40 4.79
K-Nearest Neighbor • Randomly Distributed Training Set • (2%-98%) 1-10 Neighbors
Conclusions ~Existing results are reachable ~Prognosis is the most difficult ~Better accuracy on groups than anecdotes ~Plane Separation > Max Likelihood > K-Nearest
References [1] Garcia M, Jemal A, Ward EM, Center MM, Hao Y, Siegel RL, Thun MJ. Global Cancer Facts & Figures 2007. Atlanta, GA: American Cancer Society, 2007. [2] Wolberg, Dr. William H. "Breast Cancer Wisconsin (Diagnostic) Data Set." UCI Machine Learning Repository(1995): n. pag. Web. 30 Nov 2010. [3] Zielinski, Jerzy, NidhalBouaynaya, and Dan Schonfeld. "Two-dimensional ARMA modeling for breast cancer detection and classification.” Engineering Village (2010): n. pag. Web. 30 Nov 2010. [4] Zwitter, Matjaz, and Milan Soklic. "Breast Cancer Data Set."UCI Machine Learning Repository (1988): n. pag. Web. 20 Nov 2010.