ICPSR General Structural Equation Models
ICPSR General Structural Equation Models. Interactions in latent variable models An introduction to MPLUS software An introduction to latent class models Models for (conceptually!) categorical dependent variables. Week 4 #4 (last class). Article discussion:.

ICPSR General Structural Equation Models
E N D
Presentation Transcript
ICPSR General Structural Equation Models • Interactions in latent variable models • An introduction to MPLUS software • An introduction to latent class models • Models for (conceptually!) categorical dependent variables Week 4 #4 (last class)
Article discussion: “Reexamination and Extension of Kleine, Llein and Kerman’s Social Identity Model of Mundane Consumption: the Mediating Role of the Appraisal Process” J. Of Consumer Research, 28, 2002, 659-660.
Article discussion: “Reexamination and Extension of Kleine, Llein and Kerman’s Social Identity Model of Mundane Consumption: the Mediating Role of the Appraisal Process” J. Of Consumer Research, 28, 2002, 659-660. Data pooled, 2 groups: tennis players; aerobics group Tested H0: S[1] = S[2] (p>.50) Tennis players, 68% response, listwise N=213 vs. N of 318. Aerobics, 73% response, listwise N= 329 vs. N of 359
“Reexamination and Extension of Kleine, Llein and Kerman’s Social Identity Model of Mundane Consumption: the Mediating Role of the Appraisal Process” J. Of Consumer Research, 28, 2002, 659-660. Measurement model fit to data: “fit the aerobics data well, … residuals normally distributed” Common method variance… to test, allowed covariances among residuals of identically worded questions… “mimimal effect (change in r <.01) on interfactor correlations. Original model: identity importance DV. 2nd model reverses direction entirely: 3 commitment variables as DVs “significant reduction in model fit” (table 1, model 2 Xsq=15605, df=373 vs. 1541.6 df=370 for “a priori structural model” and 1422.1 with post-hoc modifications to this). Question not answered: which additional restrictions were in the “reversed” model?
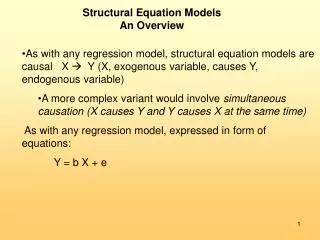
A b E D C The chi-square value reflects, among other things, the restrictions in this model, eg. AE coefficient = 0.
E b A D C In this model, another set of restrictions is imposed (e.g., EA direct path =0). If the true model involves reciprocal causation, neither model is specified correctly “Tests” – chi-square comparisons” – are not formal (not nested) Moreover, they reflect the “other” restrictions in the model and not an AE vs. E—A test.
INTERACTIONS IN LATENT VARIABLE STRUCTURAL EQUATION MODELS Y = b0 + b1 X1 + b2 X2 + b3 (X1*X2) + e If X is categorical: multiple group modeling If X is continuous: more complicated • Categorical: can also model as dummy variables.
Interactions Easiest case: X1 is 0/1 X2 ix 0/1 Options: 1.Manually construct X3=X1*X2 outside SEM software, estimate model with X1,X2,X3 exogenous. Test for interaction: fix regression coefficient for X3 to 0. 2. Create two groups: X1=0 and X1=1. In each group, X2 as exogenous variable. Test for interaction would be H0: gamma[1] = gamma[2]. Extensions for X1, X2 >2 categories straightfoward (more groups/dummy variables)
Interactions Option 3: Model as a 4-group problem. X1 1 0 X2 1 gr1 gr2 0 gr3 gr4 AL[1]=0 al[2], al[3],al[4] parameters to be estimated. Main effects model (no interaction) would allow for al[2]≠al[3] ≠al[4] but pattern of differences would be constrained such that…..
Interactions Model as a 4-group problem. X1 1 0 X2 1 gr1 gr2 0 gr3 gr4 AL[1]=0 al[2], al[3],al[4] parameters to be estimated. Main effects model (no interaction) would allow for al[2]≠al[3] ≠al[4] but pattern of differences would be constrained such that….. The group1 vs. group 2 difference = group 3 vs. group 4 difference (or group 1 vs. 3 difference = group 2 vs. group 4). Programming in LISREL would be: Al[1] – Al[2] = al[3]- al[4] 0 – al[2] = al[3] – al[4] Al[2] = al[4]-al[3] LISREL: CO al 2 1 = al 4 1 – al 3 1 Test for interaction: run another model removing this constraint (all AL completely free except group 1) … more examples provided in text
Interactions Interactions involving continuous variables. Case 1: One continuous (single or multiple indicator) and one categorical variable EASY: categorical variable becomes basis for grouping. Group 1 Eta = gamma[1] Ksi + zeta Group 2 Eta = gamma[2] Ksi + zeta Test for interaction: H0: gamma[1] = gamma[2] Case 2: Two continuous single indicator variables Also somewhat straightforward: Create single-indicator X3 = X2*X1 Case 3: Two continuous multiple indicator latent variables This is not so easy! Substantial literature on this question See course outline for extended list. (Schumacker and Mracoulides, eds., Interaction and Nonlinear Effects in Structural Equation Modeling). Case 3A, not talked about much: X1 single indicator Ksi1 (X2, X3,X4) Create: X1X2 , X1X3, X1,X4
Latent variable interactions Major approaches: • Kenny-Judd • Simplified variants of Kenny-Judd, modifications, etc. (Joreskog & Yang, 1996; Ping) • Two-stage least squares (get instrumental variables) • Use SEM to estimate 2 factor model, save latent variable “scores” (analogous to factor scores), then use these
Latent variable interactions • Use SEM to estimate 2 factor model, save latent variable “scores” (analogous to factor scores), then use these In LISREL: Mo nx=6 nk=2 lx=fu,fi ph-sy,fr td=sy Va 1.0 lx 1 1 lx 4 2 Fr lx 2 1 lx 3 1 lx 5 2 lx 6 2 PS=Newfile.psf OU
Latent variable interactions • Use SEM to estimate 2 factor model, save latent variable “scores” (analogous to factor scores), then use these In LISREL: Mo nx=6 nk=2 lx=fu,fi ph-sy,fr td=sy Va 1.0 lx 1 1 lx 4 2 Fr lx 2 1 lx 3 1 lx 5 2 lx 6 2 PS=Newfile.psf OU LISREL documentation suggests that a simple regression can be estimated in PRELIS: Sy=newfile.psf ne inter=ksi1*ksi2 rg y on ksi1 ksi2 ksi1ksi2 ou
Latent variable interactions LISREL documentation suggests that a simple regression can be estimated in PRELIS: Sy=newfile.psf ne inter=ksi1*ksi2 rg y on ksi1 ksi2 ksi1 ksi2 ou …. But it should also be possible to a) construct “inter” (=ksi1*ksi2) and read the 3 new “single indicator” variables back into LISREL for use with other variables (including those which form the basis of multiple-indicator endogenous variables. If all else fails, construct a LISREL model for Ksi1, Ksi2, and put FS (factor score regressions) on the OU line: OU ME=ML FS MI ND=4 .. And use factor score regressions to compute estimated factor scores in any stat package (incl. PRELIS)
Example: INTERACTION MODEL WITH INTERACTION TERM CREATED EXTERNALLY SINGLE INDICATORS FOR EXOGENOUS LVS INVOLVED IN INTERACTION DA NO=1111 NI=10 MA=CM CM FI=G:\ICPSR\INTERACTIONS\INT5b.COV FU FO (10F10.7) LABELS lv1 lv2 interact sex race v217 v216 v125 v127 v130 se 8 9 10 1 2 3 4 5 6 7/ mo ny=3 ne=1 LY=FU,FI PS=SY,FR TE=SY c nx=7 nk=7 fixedx ga=fu,fr va 1.0 ly 1 1 fr ly 2 1 ly 3 1 ou me=ml se tv mi sc
Example: LISREL Estimates (Maximum Likelihood) LAMBDA-Y ETA 1 -------- v125 1.00 v127 1.34 (0.24) 5.59 v130 0.65 (0.11) 5.74 GAMMA lv1 lv2 interact sex race v217 -------- -------- -------- -------- -------- -------- ETA 1 -0.04 -0.21 0.85 0.22 -0.30 0.05 (0.06) (0.08) (0.45) (0.11) (0.13) (0.03) -0.65 -2.57 1.89 2.10 -2.27 1.75 GAMMA v216 -------- ETA 1 0.09 (0.03) 2.92 Dep var = inequality att’s (high score “more individual effort”) Lv1=relig. Lv2=econ. status
Kenny-Judd model Typically, literature (e.g., Kenny-Judd, 1984; Hayduk, 1987) starts with 2-indicator example (2 LV’s each with 2 indicators). Ksi1 Ksi2 Ksi1*Ksi2 (interaction term) Indicators: Ksi1: x1 x2 Ksi2: x3 x4 Possible product terms: x1*x3 x1*x4 x2*X3 X2*x4 Kenny-Judd model use 4 product terms but Joreskog and Yang show that the model can be constructed with 1 product term.
Kenny-Judd model Typically, literature (e.g., Kenny-Judd, 1984; Hayduk, 1987) starts with 2-indicator example (2 LV’s each with 2 indicators). Ksi1 Ksi2 Ksi1*Ksi2 (interaction term) Indicators: Ksi1: x1 x2 Ksi2: x3 x4 Possible product terms: x1*x3 x1*x4 x2*X3 X2*x4 Kenny-Judd model use 4 product terms but Joreskog and Yang show that the model can be constructed with 1 product term. Kenny-Judd do not include constant intercept terms (alpha, tau).. But even if dependent variable, Ksi1, Ksi2 and zeta have zero means, alpha will still be nonzero. - means of observed variables functions of other parameters in the model and therefore intercept terms have to be included. - Nonnormality even if x’s are normal (ADF estimation often recommended if sample size acceptable)
Kenny-Judd model alpha=1 term
Kenny-Judd model, mod. INTERACTION MODEL KENNY JUDD MODIFICATION (JORESKOG AND YANG) ONE INTERACTION INDICATOR 3 INDICATORS PER L.V. DA NO=1111 NI=22 CM FI=G:\ICPSR2000\INTERACTIONS\INT5c.COV FU FO (22F20.11) ME FI=G:\ICPSR2000\INTERACTIONS\INT5C.MN FO (22F20.11) LABELS v181 v9 v190 v221 v226 v227 relinc1 relinc2 relinc3 relinc4 relinc5 relinc6 relinc7 relinc8 reling9 sex race v217 v216 v125 v127 v130 se 20 21 22 1 2 3 4 5 6 9 16 17 18 19/ mo ny=3 ne=1 NX=11 NK=7 LY=FU,FI PS=SY,FR C TE=SY TX=FR KA=FI C LX=FU,FI GA=FU,FR PH=SY,FR TD=SY AL=FI TY=FR va 1.0 ly 1 1 fr ly 2 1 ly 3 1 FI PH 3 1 PH 3 2 FR KA 3 VA 1.0 LX 1 1 LX 4 2 LX 7 3 LX 8 4 LX 9 5 LX 10 6 LX 11 7 FR TD 1 1 TD 2 2 TD 3 3 TD 4 4 TD 5 5 TD 6 6 TD 7 7 FR LX 2 1 LX 3 1 LX 5 2 LX 6 2 LX 7 1 LX 7 2 CO LX(7,1)=TX(1) CO LX(7,2)=TX(4) CO KA(3) = PH(2,1) FI PH 3 1 PH 3 2 CO PH(3,3) = PH(1,1)*PH(2,2) + PH(2,1)**2 CO TX(6) = TX(1)*TX(4) FI TD(8,8) TD(9,9) TD(10,10) TD(11,11) CO TD(7,7) = TX(1)**2*TD(3,3) + TX(4)**2*TD(1,1) + PH(1,1)*TX(4) + C PH(2,2)*TX(1) + TD(1,1)*TD(4,4) OU ME=ML SE TV ND=3 AD=off
Kenny-Judd model, modified Joreskog/Yang Parameter Specifications LAMBDA-Y ETA 1 -------- v125 0 v127 1 v130 2 LAMBDA-X KSI 1 KSI 2 KSI 3 KSI 4 KSI 5 KSI 6 -------- -------- -------- -------- -------- -------- v181 0 0 0 0 0 0 v9 3 0 0 0 0 0 v190 4 0 0 0 0 0 v221 0 0 0 0 0 0 v226 0 5 0 0 0 0 v227 0 6 0 0 0 0 relinc3 Constr'd Constr'd 0 0 0 0 sex 0 0 0 0 0 0 race 0 0 0 0 0 0 v217 0 0 0 0 0 0 v216 0 0 0 0 0 0
Kenny-Judd model, modified Joreskog/Yang GAMMA KSI 1 KSI 2 KSI 3 KSI 4 KSI 5 KSI 6 -------- -------- -------- -------- -------- -------- ETA 1 -0.023 -0.003 -0.008 0.209 -0.324 0.051 (0.009) (0.015) (0.004) (0.098) (0.125) (0.024) -2.557 -0.198 -1.984 2.130 -2.593 2.094 GAMMA KSI 7 -------- ETA 1 0.080 (0.029) 2.735
Latent class models Basic parameters: • Latent class probabilities • Conditional probabilities (given one is in latent class A, what are the probabilities that one will be in cat i of indicator j? … prob’s sum to 1.0). Parameter constraints are possible (in some cases, needed for identification).
A latent class model • Software: MLLSA NUMBER OF LATENT CLASSES REQUESTED: 5 START VALUES ENTERED FOR LATENT CLASS PROBABILITIES: .630000 .110000 .160000 .020000 .080000 START VALUES ENTERED FOR CONDITIONAL PROBABILITIES: .000000 .000000 1.000000 .450000 .550000 .000000 .000000 .000000 1.000000 .250000 .750000 .000000 .000000 .000000 1.000000 1.000000 .000000 .000000 .000000 .000000 .300000 .350000 .350000 .000000 .500000 .250000 .250000 1.000000 .000000 .000000 .000000 .000000 .800000 .200000 .000000 1.000000 .000000 .000000 .000000 .020000 .370000 .400000 .310000 .060000 .540000 .300000 .100000 1.000000 .000000 .000000 .000000 .000000 .900000 .100000 .000000 1.000000 .000000 .000000 .000000 .600000 .400000 1.000000 .000000 .000000 .000000 .600000 .400000 1.000000 .000000 .000000
A latent class model • Software: MLLSA ***** ITERATION STEPS ***** DEVIATION = .00306576 ITERATION = 10 DEVIATION = .00078193 ITERATION = 20 DEVIATION = .00041910 ITERATION = 30 DEVIATION = .00024801 ITERATION = 40 DEVIATION = .00015106 ITERATION = 50 DEVIATION = .00009318 ITERATION = 60 DEVIATION = .00005788 ITERATION = 70 DEVIATION = .00004791 ITERATION = 74 ------------------------------------------------------------------------------- ------------------------------------------------------------------------------- FINAL LIKELIHOOD RATIO CHI-SQUARE = 155.032400 FINAL PEARSON CHI-SQUARE = 157.236800 INDEX OF DISSIMILARITY = .034417 ------------------------------------------------------------------------------- FINAL LATENT CLASS PROBABILITIES: .627384 .110530 .160754 .018552 .082779
Latent class model • FINAL CONDITIONAL PROBABILITIES: • LATENT CLASS = 1 2 3 4 . . . • PLAN ENTIRE .0000 .3546 .0000 .2394 .0000 • PLAN PART .0000 .6454 .0000 .7606 .0000 • PLAN NOT 1.0000 .0000 1.0000 .0000 1.0000 • SUPTIME NOT 1.0000 .0000 .0000 1.0000 .0000 • SUPTIME 1/4 .0000 .4019 .3166 .0000 .8308 • SUPTIME 1/4-1/2 .0000 .3333 .2867 .0000 .1692 • SUPTIME 1/2+ .0000 .2648 .3966 .0000 .0000 • NSUPER 0 1.0000 .0213 .0975 1.0000 .0000 • NSUPER 1-4 .0000 .3688 .3032 .0000 .9990 • NSUPER 5-19 .0000 .4019 .4514 .0000 .0010 • NSUPER 20+ .0000 .2080 .1479 .0000 .0000 • TIMEPLAN NOT 1.0000 .0000 1.0000 .0000 1.0000 • TIMEPLAN UP TO 1/ .0000 .5745 .0000 .5915 .0000 • TIMEPLAN 1/4+ .0000 .4255 .0000 .4085 .0000 • FINAL LATENT CLASS PROBABILITIES: • .627384 .110530 .160754 .018552 .082779
Latent class model ASSIGNMENT OF RESPONDENTS TO LATENT CLASS: CELL OBSERVED EXPECTED ASSIGN TO CLASS MODAL PROBABILITY 1 .00 .00 1 .0000 2 .00 .00 1 .0000 3 2401.00 2401.00 1 1.0000 4 .00 .00 1 .0000 5 .00 .00 1 .0000 6 42.00 19.00 3 1.0000 7 .00 .00 1 .0000 8 .00 .00 1 .0000 9 9.00 17.20 3 1.0000 10 .00 .00 1 .0000 11 .00 .00 1 .0000
MPlus software See director /Week4Examples/MPlus TITLE: categorical #1 DATA: FILE IS H:\ICPSR2003\Week4Examples\MPlus\Categor.dat VARIABLE: NAMES ARE REGION V166-V175 EDUC AGE SEX; USEV = V166-V175; CATEGORICAL = V166-V175; ANALYSIS: TYPE = EFA 1 3; ESTIMATOR WLSMV; Exploratory factor analysis with binary variables
MPlus software VARIMAX ROTATED LOADINGS 1 2 3 ________ ________ ________ V166 0.853 0.127 0.427 V167 0.488 0.693 0.397 V168 0.655 0.408 0.406 V169 0.533 0.019 0.753 V170 0.370 0.041 0.993 V171 0.626 0.192 0.662 V172 0.531 0.071 0.598 V173 0.693 0.336 0.473 V174 0.002 0.836 -0.080 V175 -0.739 -0.019 -0.330 PROMAX ROTATED LOADINGS 1 2 3 ________ ________ ________ V166 0.996 -0.064 -0.015 V167 0.360 0.623 0.196 V168 0.659 0.281 0.093 V169 0.358 -0.089 0.646 V170 -0.024 -0.019 1.082 V171 0.512 0.068 0.459 V172 0.432 -0.039 0.439 V173 0.691 0.198 0.158 V174 -0.116 0.880 -0.111 V175 -0.904 0.153 0.067 PROMAX FACTOR CORRELATIONS 1 2 3 ________ ________ ________ 1 1.000 2 0.370 1.000 3 0.746 0.197 1.000 Exploratory factor analysis with binary variables
MPlus reads raw data write outfile = 'h:\icpsr2003\Week4Examples\Mplus\catmiss.dat' /region v166 v167 v168 v169 v170 v171 v172 v173 v174 v175 v356 v355 v353 (14F3.0). • Must use WRITE command in SPSS (or PUT command in SAS) to write raw data to file. • Initially, listwise delete, though MPlus will handle missing data
Latent class model using MPlus TITLE: latent class model #1 DATA: FILE IS H:\ICPSR2003\Week4Examples\MPlus\Categor.dat VARIABLE: NAMES ARE REGION V166-V175 EDUC AGE SEX; USEV = V166-V169; CLASSES = C(2); CATEGORICAL = V166-V169; ANALYSIS: TYPE = MIXTURE; MITERATIONS=100; MODEL: %OVERALL% [v166$1*-1 V167$1*1 V168$1*1 V169$1*1]; %c#2% [V166$1*-2 V167$1*0 v168$1*0 v169$1*0]; OUTPUT: TECH8;
Latent class model using MPlus Chi-Square Test of Model Fit for the Latent Class Indicator Model Part Pearson Chi-Square Value 72.161 Degrees of Freedom 6 P-Value 0.0000 Likelihood Ratio Chi-Square Value 77.561 Degrees of Freedom 6 P-Value 0.0000
Latent class model using MPlus FINAL CLASS COUNTS AND PROPORTIONS OF TOTAL SAMPLE SIZE BASED ON ESTIMATED POSTERIOR PROBABILITIES Class 1 540.13069 0.22752 Class 2 1833.86931 0.77248 CLASSIFICATION OF INDIVIDUALS BASED ON THEIR MOST LIKELY CLASS MEMBERSHIP Class Counts and Proportions Class 1 557 0.23463 Class 2 1817 0.76537
Latent class model using MPlus LATENT CLASS INDICATOR MODEL PART Class 1 Thresholds V166$1 -0.640 0.115 -5.561 V167$1 1.317 0.142 9.297 V168$1 0.141 0.121 1.162 V169$1 2.244 0.200 11.232 Class 2 Thresholds V166$1 -6.577 1.239 -5.307 V167$1 -2.152 0.106 -20.388 V168$1 -5.320 0.610 -8.718 V169$1 -0.999 0.063 -15.803 LATENT CLASS REGRESSION MODEL PART Means C#1 -1.222 0.073 -16.713
Latent class model using MPlus LATENT CLASS INDICATOR MODEL PART IN PROBABILITY SCALE Class 1 V166 Category 1 0.345 0.026 13.266 Category 2 0.655 0.026 25.164 V167 Category 1 0.789 0.024 33.406 Category 2 0.211 0.024 8.952 V168 Category 1 0.535 0.030 17.735 Category 2 0.465 0.030 15.403 V169 Category 1 0.904 0.017 52.210 Category 2 0.096 0.017 5.536 Class 2 V166 Category 1 0.001 0.002 0.808 Category 2 0.999 0.002 580.389 V167 Category 1 0.104 0.010 10.576 Category 2 0.896 0.010 90.960 V168 Category 1 0.005 0.003 1.647 Category 2 0.995 0.003 336.475 V169 Category 1 0.269 0.012 21.651 Category 2 0.731 0.012 58.781 V166=God V167=Life after death V168=A soul V169 = The devil
LATENT CLASS INDICATOR MODEL PART IN PROBABILITY SCALE Class 1 V166 Category 1 0.179 0.031 5.843 Category 2 0.821 0.031 26.794 V167 Category 1 0.650 0.050 12.922 Category 2 0.350 0.050 6.973 V168 Category 1 0.335 0.051 6.520 Category 2 0.665 0.051 12.948 V169 Category 1 0.825 0.030 27.419 Category 2 0.175 0.030 5.831 Class 2 V166 Category 1 0.000 0.000 0.000 Category 2 1.000 0.000 0.000 V167 Category 1 0.082 0.010 7.818 Category 2 0.918 0.010 87.908 V168 Category 1 0.000 0.000 0.000 Category 2 1.000 0.000 0.000 V169 Category 1 0.238 0.015 15.732 Category 2 0.762 0.015 50.278 Class 3 V166 Category 1 0.791 0.147 5.367 Category 2 0.209 0.147 1.417 V167 Category 1 1.000 0.000 0.000 Category 2 0.000 0.000 0.000 V168 Category 1 0.979 0.110 8.918 Category 2 0.021 0.110 0.193 V169 Category 1 1.000 0.000 0.000 Category 2 0.000 0.000 0.000 Latent class model using MPlus 3 class model V166=God V167=Life after death V168=A soul V169 = The devil FINAL CLASS COUNTS AND PROPORTIONS OF TOTAL SAMPLE SIZE BASED ON ESTIMATED POSTERIOR PROBABILITIES Class 1 565.88686 0.23837 Class 2 1697.27605 0.71494 Class 3 110.83709 0.04669
Last slide Email: baer@uvic.ca Put ICPSR in subject heading