Structural Equation Models An Overview
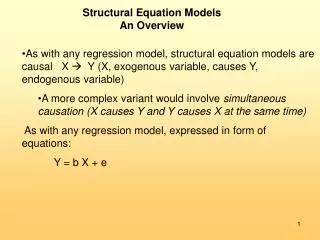
Structural Equation Models An Overview. As with any regression model, structural equation models are causal X Y (X, exogenous variable, causes Y, endogenous variable) A more complex variant would involve simultaneous causation (X causes Y and Y causes X at the same time)

Structural Equation Models An Overview
E N D
Presentation Transcript
Structural Equation ModelsAn Overview • As with any regression model, structural equation models are causal X Y (X, exogenous variable, causes Y, endogenous variable) • A more complex variant would involve simultaneous causation (X causes Y and Y causes X at the same time) • As with any regression model, expressed in form of equations: • Y = b X + e
Structural Equation ModelsAn Overview • SEM models usually involve continuous variables, or at least quantitative variables that are conceptually continuous • dummy variables can be handled, but only in a very limited way • a regression model is a simple form of structural equation model • a factor analysis model is a form of structural equation model too • more complex SEMs put together features of both • with the ability to simultaneously estimate parameters in multiple groups, SEMs can also subsume ANOVA models
Models can be expressed as path diagrams Structural Equation Models Above is part of a path diagram for a regression model, with X2 dependent and X1 independent. Actually, we need to add the error term to the model to make the diagram complete:
Structural Equation Models • The model parameters in this simple model are: • b1, more familiar as the regression coefficient connecting X1 with X2 • the estimated variance of the error term • the estimated variance of X1, which in this case is the same as the observed variance of X1 • There are 3 empirical pieces of information from which we can estimate these 3 parameters • the variance of X1 ; the variance of X2 • the covariance of X1 & X2
Structural Equation Models • The equation in this model is: • X2= b1 X1 + e1 • No intercept? Structural equation models generally involve mean-centered variables, so there is no intercept in equations • only in more complicated “mean models” will we worry about the intercept • we will cover mean/moment models later in the course • in most regression models, the intercept is of less interest than the slope parameters (e.g., we want to know that as a person’s age increases by 1 year, he/she will watch 3 more minutes of television, but we don’t care so much that the “expected” amount of TV viewing at age 0 is 30 minutes [likely incorrect anyway]
Structural Equation Models A more complex model Equations: X4 = b1*X1 + b2*X2 + e4 X5 = b3*X1 + b4*X2 + b5*X3 + e5 This model assumes that the path from X3 to X4 is 0
Structural Equation Models Previous model assumed covariance between e4, e5 = 0 This model relaxes this assumption. Same for correlations (covariances) among X1, X2, X3
Structural Equation Models In this model, X1, X2 and X3 are exogenous (independent) X4, X5 are endogenous (dependent) The error terms, e4 and e5, are technically exogenous too.
Structural Equation Models This model has 3 equations X2,X3 are endogenous but we think of them as intervening variables in path analysis terms Psychologists tend to use the term “mediators” instead of or in addition to “intervening variables”) If variables all standardized, effect of X1 on X4 (total effect) is: (b1*b2) +( b3*b4)
This model similar to previous, but path involving b5 is added: Structural Equation Models Testable assumption: b5=0 (test of this model vs. previous model) b5 represents direct effect of X1 on X4 b3*b4, b1*b2 are indirect effects Total effect=(b1*b2) + (b3*b4) + b5
Structural Equation Models Model parameters: b1,b2,b3,b4,b5 Also a type of model parameter: All variances and covariances among exogenous variables Here, X1 is exogenous but X2,X3,X4 not. e2,e3 and e4 are exogenous
Structural Equation Models There are 4 observed variables: X1,X2,X3,X4. Let S be the covariance matrix of observed covariances among these variables. Empirical covariance matrix, S, has 10 elements (all possible covariances between X-variables). Reproduced covariance matrix (Σ) is an estimate of S based on the model parameters. Itcan be calculated from model parameters.
Structural Equation Models • A non-recursive model • We usually deal with recursive models, but non-recursive models can be handled too. • (Not all of them, though: the model shown here is under-identified, which means its parameters are not uniquely estimable)
Manifest and Latent variables In this course, we concentrate on Structural Equation Models involving LATENT VARIABLES. Properties of latent variables: - Latent variables are not directly measured • LVs can be said to represent underlying “constructs” • some relationship (hopefully linear, with indicators (manifest variables) • Relationship rarely involves perfect correlation.
Manifest and Latent variables Synonyms: Latent variable: construct unobserved variable factor Manifest variable: indicator item observed variable (an error term is, technically, a type of latent variable)
Manifest and Latent variables Fundamental insight that motivates much of what is done in the LV SEM world: • We can rarely measure without error Related: • Measurement error is serious stuff (major consequences for parameter estimation) • There are many different sources of measurement error and these are generally not random • Bad enough if it’s random, but non-random measurement error biases parameter estimates obtained by “conventional” means • Obtaining multiple measures (multiple indicators) helps (think of it as “triangulation”)
Multiple measurement Example: How happy a child is Possible measures: - child care worker #1 rates the child - child care worker #2 rates the child - child asked to show how happy by piling building blocks - video tape number of times child smiles Each of these measures is fallible (indeed, can be totally wrong in particular cases), though we expect the measurements to be correlated
LATENT VS. MANIFEST VARIABLES: DIAGRAMMING Structural Equation Models Latent1 is a “latent variable” – not directly measured. In factor analysis, this would be a “factor”. Diagrammatically , circle = latent variable square = manifest variable (error terms sometimes shown as enclosed with circle, sometimes just labeled but not enclosed by a circle).
Structural Equation Models In factor analysis, Latent1 would be a “factor” with 4 indicators. The model has four measurement equations: X1 = b1*Latent1 + e1 X2 = b2*Latent1 + e2 X3 = b3*Latent1 + e3 X4 = b4*Latent1 + e4
A model with 2 latent variables: Structural Equation Models In this model, the 2 latent variables are correlated; this is indicated by the curved lines with “double headed” arrows. In factor analysis, this would be a two factor model This model has 6 equations
Equations: X1 = b1*Latent1 + e1 X2 = b2*Latent1 + e2 X3 = b3*Latent1 + e3 X4 = b4*Latent2 + e4 X5 = b5*Latent2+ e5 X6 = b6*Latent2 + e6 There is a correlation between X4 and X1, but it is expressed through the parameters b4, b1 and the covariance between Latent1 and Latent2 Structural Equation Models(Confirmatory Factor Analysis)
Previous model an example of simple structure. It is possible to add parameters (in this case, Latent2 X3: The equation becomes X3 = b3*Latent1 + b7*Latent2 + e3 Structural Equation Models(Confirmatory Factor Analysis) In factor analysis, we’d call item X3 “factorally complex”
This model has 6 manifest variables (X1 through X6). The covariance matrix S represents the empirically observed covariances among these 6 variables. This model has 8 exogenous variables: e1, e2, e3, e4, e5, e6, Latent1 and Latent2 We may model covariances among exogenous variables (curved arrow) but not among endogenous variables. [Why? Algebraically, we can always express the latter as a function of the former + regression coefficients] Structural Equation Models(Confirmatory Factor Analysis)
Model Parameters in this model: • 6 regression coefficients (b1 through b6) • Variances and covariances among the exogenous variables (variance of e1,e2,e3,e4,e5,e6, variance of Latent1, variance of Latent 2 AND the covariance between Latent1 and Latent2) Structural Equation Models(Confirmatory Factor Analysis)
Manifest variable variances and covariances • The “building blocks” of structural equation models • As is the case with regression models, we can estimate most SEM models without the raw data – just need variances and covariances** and sometimes the means ** well, at least until we get to models fornon-normal data or models for missing data!
Manifest variable variances and covariances Models discussed here are primarily for continuous variables (X-variables and Y-variables) Latent variables are conceptually continuous. Models are based on covariances of observed variables COV(X,Y) = Σ (Xi)(Yi) / (N-1) where Xi is mean-centred value of X (X minus mean of X)
Manifest variable variances and covariances Models are based on covariances of observed variables COV(X,Y) = Σ (Xi)(Yi) / (N-1) where Xi is mean-centred value of X (X minus mean of X) In regression b* = covxx-1covxy where b* = vector of b’s without intercept
Manifest variable variances and covariances What we lose when we work with covariances: • Means and intercepts (not serious: we can easily bring these back in later) • Think about OLS assumptions (discuss)
Manifest variable variances and covariances What we lose when we work with covariances: 2. Think about OLS assumptions • non-linearities (some are readily transformable – no problem(!), but some are not) • Interactions (type of non-linearity) • Residuals (detection of outliers, etc.) • Form of distribution (skewed? Kurtotic?)
Measurement Error, and is relationship to SEM models Regular regression, assumes X1, X2 measured without error X1, X2 imperfect indicators of L1 and L2 respectively.
Measurement Error, and is relationship to SEM models X1, X2 imperfect indicators of L1 and L2 respectively. • Imagine X1 correlated .80 with L1; X2 correlated .80 with L2 • If the real correlation between L1 and L2 is .50, the observed correlation between X1 and X2 will only be .50 x .64 = .32 • This is sometimes referred to as attenuation. • SEM MODELS WITH LATENT VARIABLES CORRECT FOR ATTENUATION • The price: we usually need 3 indicators per latent variable to solve equations (can sometimes get away with 2)
Measurement Error, and is relationship to SEM models • Sadly, in more complex models with multiple LVs, parameter coefficients aren’t just downward biased • Could be that a coefficient is actually higher than it should be • (“all bets are off”) • Need models that will adjust for measurement error (!), which is what SEM models will do for us
Models with Causal Relationships among Latent Variables Extension involving causal relationships among LVs. Factor analysis latent1, latent2 exogenous Latent 1 exogenous, Latent2 endogenous Error term: d2 -
Models with Causal Relationships among Latent Variables • Equations: • Measurement equations: • X1 = 1*Latent1 + e1 • X2=b2*Latent1 + e2 • X3 = b3*Latent1 + e3 • X4 = b4*Latent2 + e4 • X5 = b5* Latent2 + e5 • X6 = 1*Latent2 + e6 • 2. Struct. Equations among latent variables: • Latent2 = b1*Latent1 + d2
Special Cases SEM models are ideally suited for models where all of the variables are perfectly normally distributed (and, by implication, conceptually continuous), where we have multiple indicators for each variable, where relationships are all linear What about situations where this is not the case?
Special Cases We will spend a lot of time in the course discussing the “limits” and how these are dealt with. The following is a very cursory and simplified summary. • What if I don’t have multiple indicators for all of my variables? • Single-indicator variables can be included in models but we must make stronger assumptions about error (e.g., “measured without error” or assume a given % of error and further assume it is random)
Special Cases • Can I use dummy variables? • As totally exogenous variables, yes (interestingly, texts tend not to provide examples, discuss interpretation issues, etc.) • As endogenous variables, generally no ** • What if my variables are measured on 4-point or 5-point scales instead of being continuously distributed? • There is a variety of approaches to dealing with “coarsely categorized” data, providing the variables included in the model are conceptually continuous • ** though we will discuss latent class and “mixture” models late in the course
Special Cases • What about interaction models? • Though not impossible, these are extremely difficult • Exception: where one of the X-variables involved in the interaction is categorical and data can be “grouped” (e.g., interaction between country and education with dependent variable religiosity: could model this as a “multiple group” problem Group 1 = USA Group 2=Britain etc.). • I have a model with an N of 45. Can I run an SEM model on it? • Generally, no. For virtually all SEM models, the minimum N is in the 100-200 range. Larger sample sizes may be required for non-normal data models.
Special Cases 6. A quantitative methodologist in my department told me not to even think about SEM models because they assume perfectly normally distributed data and in real life we rarely see this. • This critique is “old” and predates the development of new approaches to deal with non-normality • SEM models are fairly robust to departures from normality anyway
Special Cases 7. A colleague told me that LISREL represents the absolute height of abstracted empiricism. The method gives us a false sense of security around the precision of estimates when we’d be far better off with “rough and dirty” estimates from a simple set of OLS equations. • Interestingly, LISREL is implicitly realist and not empiricist in epistemological orientation; technically, an empiricist would say, “if you can’t measure it, it doesn’t exist” and latent variables are by definition variables that you can’t measure (directly). • The fact that parameter estimates may have wide-ranging sources of imperfection should not prevent us from seeking to reduce bias as much as possible. Clearly, an unbiased estimate is better than a biased estimate. Whether the researcher chooses to present estimates as “highly precise” or otherwise is a different issue.
Special Cases 8. The Problem with LISREL is that it is too easy to mess up without us knowing that our model is based on incorrect assumptions. • This is not a reason to abandon the technique, but rather a reason to learn how to use it properly. We will spend time in class discussing the problem of the estimation of models that make no sense (with appropriate examples from the literature!)
A few words about SEM software • Generally expensive (typically $700US for academic versions) • Sometimes available as part of site licenses: • Somewhat restricted SEM software is built into SAS as the CALIS procedure • Some university campus site licenses for SPSS contain the AMOS “module” (but many do not)
The Software for SEM models In most cases, a covariance matrix must be generated. Usually, an SEM program will do this, but sometimes it is necessary to generate the matrix from other software, such as SPSS or SAS, using PROC CORR (SAS), Correlations (SPSS), etc. Even if the program does this internally, this is the “first step”.
The Software for SEM models SAS: PROC CALIS SPSS: No built-in program, but AMOS is sold as an “add on”. AMOS can read SPSS files LISREL can read files of many types, including SPSS and SAS. Other programs: EQS, MPlus
The Software for SEM models: AMOS AMOS works with a graphic interface. Draw the model of interest, insert variable names connected to an SPSS dataset, then “attach” this dataset. Intuitively appealing Limitation: a nightmare with very large models which clutter the screen and are hard to follow
The Software for SEM models: The SAS CALIS procedure • Strong programming similarities with EQS • Some programming similarities with the “SIMPLIS” version of LISREL • Basically, we need to: • Write out equations a) linking manifest to latent variables b) linking latent variables to other latent variables • Identify exogenous variable variances and covariances as parameters
The Software for SEM models: The LISREL program • LISREL’s basic programming form is matrix • A bit more difficult to get used to, but very powerful once mastered • LISREL also has a scalar (equation-based) facility called SIMPLIS. • This course makes more use of LISREL than other software (though in the first week we will use AMOS, which is a good learning tool)
The Software for SEM models: EQS • EQS basic programming form is scalar • Some matrix-style specification possible • Basic form: write out equations, specify variances and covariances of exogenous variables • An option in this course (will be discussed, briefly, if there is class interest). • Program most commonly used in Psychology
The Software for SEM models: Other Software MPlus (nice generalizations to latent class, mixture models etc.) -- we will try to present some MPlus examples in the class Mx (free distribution) – matrix form, user interface more difficult EZPath
Last slide Tomorrow’s class: Translating diagrams to equations and vice versa Working with AMOS Specifying model parameters Covariance algebra for SEM models (scalar form)