Download
1 / 59
670 likes | 919 Vues
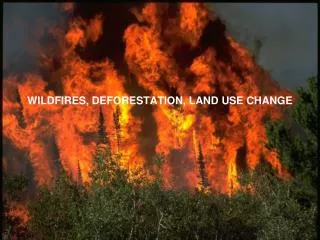
Land change modelling. Gilberto Câmara, Pedro Andrade. Licence: Creative Commons ̶̶̶̶ By Attribution ̶̶̶̶ Non Commercial ̶̶̶̶ Share Alike http://creativecommons.org/licenses/by-nc-sa/2.5/. images: USGS. Slides from LANDSAT. Modelling Human-Environment Interactions

E N D
Land change modelling Gilberto Câmara, Pedro Andrade Licence: Creative Commons ̶̶̶̶ By Attribution ̶̶̶̶ Non Commercial ̶̶̶̶ Share Alike http://creativecommons.org/licenses/by-nc-sa/2.5/
images: USGS Slides from LANDSAT Modelling Human-Environment Interactions How do we decide on the use of natural resources? What are the conditions favoring success in resource mgnt? Can we anticipate changes resulting from human decisions? Aral Sea 1973 1987 2000
TerraME: Computational environment for developing human-environment models Cell Spaces www.terrame.org T. Carneiro, P. Andrade, G. Câmara, A. Monteiro, R. Pereira, “TerraME: an extensible toolbox for modeling nature-society interactions” (under review).
Modelling human-environment interactions Whatmodels are needed to describehumanactions?
Modelling and Public Policy External Influences System Ecology Economy Politics Desired System State Decision Maker Scenarios Policy Options
Scenario tp + 10 Calibration Validation Models need to be Calibrated and “Validated” tp - 20 tp - 10 tp Source: Cláudia Almeida
Clocks, clouds or ants? Clouds: statistical distributions Clocks: deterministic equations Ants: emerging behaviour
Statistics: Humans as clouds y=a0 + a1x1 + a2x2 + ... +aixi +E Establishesstatisticalrelationshipwithvariablesthat are relatedtothephenomenaunderstudy Basic hypothesis: stationary processes Fonte: Verburg et al, Env. Man., Vol. 30, No. 3, pp. 391–405
Statistics: Assessment of land use drivers A. Aguiar, G. Câmara, I. Escada, “Spatial statistical analysis of land-use determinants in the Brazilian Amazon”. Ecological Modelling, 209(1-2):169–188, 2007. G. Espíndola, A. Aguiar, E. Pebesma, G. Câmara, L. Fonseca, “Agricultural land use dynamics in the Brazilian Amazon based on remote sensing and census data”, Applied Geography, 32(2):240-252, 2012. Land use models are good at allocating change in space. Their problem is: how much change will happen?
Driving factors of change (deforestation) source: Aguiar (2006)
Statistics: Humans as clouds source: Aguiar (2006) Statistical analysis of deforestation
Amazônia in 2007 x All Variables • transformações e análises de correlação • de 65 para 31 variáveis • seleção do melhor modelo • de 31 para 10 variáveis • regressão linear (AIC = -7838.222) • regressão espacial (AIC = -16120) 8580 Cells
Amazônia x Variables of 1996/2006 26 Variáveis 10 Years 25Km
Statistical-based land use models Driving factors of land use/cover change LOCATION (at time t) Driving factors of land use/cover change QUANTITY (at time t) Feedback on spatial drivers Cell suitability for each land use at time t (POTENTIAL) Rate and magnitude of change for each land use at time t (DEMAND) Feedbacks Bottom-up calculation Top-down constraint Allocation of change combining demand and cell potential at time t (ALLOCATION) Land use at time t-1 Time Loop Land use map at time t sources: P. Verburg, A.P. Aguiar
Simple Demand Difference between years Demand submodel
Potential Driving factors Potential map Transition potential submodel Multivariate Statistics Mathematics Neural Network
Potential – CLUE like Deforestation Protected Areas Subtract from Roads Potential map Transition potential submodel Ports Deforestation
Building Scenarios Trend analysis Global economic model Demand Transition Matrix (Markov chain)
Demand t+1 Landscape map at t Allocation Allocation submodel • Rank-order • Stochastic • Iterative Landscape map at t+1 Potential map at t
Scenario exploration: linking to process knowledge Cellular database construction Manaus- Boa Vista Santarém Porto Velho- Manaus São Felix/ Iriri Humaitá Apuí BR 163 Cuiabá-Santarém Boca do Acre Exploratory analysis and selection of subset of variables Aripuanã Scenario exploration
SimAmazonia Simamazonia www.csr.ufmg.br Modeling conservation in the Amazon basin SoaresFilho et al., Nature, 2006
SimAmazonia Subregiões do modelo SimAmazonia. Modeling conservation in the Amazon basin SoaresFilho et al., Nature, 2006
SimAmazonia: deforestation scenarios Business-as-usual Governance Modeling conservation in the Amazon basin SoaresFilho et al., Nature, 2006
Agent: flexible, interacting and autonomous Agents as basis for complex systems An agent is any actor within an environment, any entity that can affect itself, the environment and other agents.
Agents: autonomy, flexibility, interaction Synchronization of fireflies
Bird Flocking No central authority: Eachbirdreacts to its neighbour Notpossible to modeltheflock in a global manner. Need to necessaryto simulatethe INTERACTION betweentheindividuals
Modelling collective spatial actions Space Agent Agent Space Benenson and Torrens, “Geographic Automata Systems”, IJGIS, 2005 (but many questions remain...)
Representations Communication Communication Action Perception Environment Agent-Based Modelling: Computing approaches to complex systems Goal source: Nigel Gilbert
Modelling collective spatial actions Space Agent Agent Space source: Benenson and Torrens, “Geographic Automata Systems”, IJGIS, 2005
Agent-BasedModelingof Land change Empirical models Theoretical Models Agent-based models (ABM) range from theoretical to empirical. Theoretical models use simple generalizable ideas, whereas empirical models require more complexity and case-specific data..
Different farm sizes, different actors 30,000 ha 30,000 ha 20,000 ha 50 ha 60,000 ha 20,000 ha 61,000 ha 200 ha 50-200 ha
Frontier areas Frontier: an area of changing resource use whose boundaries are continually evolving
Modelinitialization (estimatedfarmdistribution) (b) Estimated distribution of farms in 1985 (a) Deforested areas in 1985 Deforestation - 1985
Deforestation maps (PRODES) The frontier “exploded” between 1985 and 1997
How to place agents in a frontier? São Felix do Xingu in 1985: farms are there, deforestation not yet started
Division of frontier in large and small farms Use the history of São Felix do Xingu to make assumption about farms
Extractingpatternsfromsequencesofimages M. Silva, G.Câmara, M.I. Escada, R.C.M. Souza, “Remote Sensing Image Mining: Detecting Agents of Land Use Change in Tropical Forest Areas”. International Journal of Remote Sensing, vol 29 (16): 4803 – 4822, 2008.
Hypothetical land tenure in 1985 (b) Estimated distribution of farms in 1985 (a) Deforested areas in 1985 Deforestation - 1985