Pacific Risk Exposure Databases and Models
World Bank: Catastrophe Risk Financing Initiative – Phase II ADB: Regional Partnerships for Climate Change Adaptation and Disaster Preparedness. Pacific Risk Exposure Databases and Models.

Pacific Risk Exposure Databases and Models
E N D
Presentation Transcript
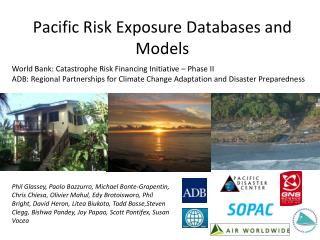
World Bank: Catastrophe Risk Financing Initiative – Phase II ADB: Regional Partnerships for Climate Change Adaptation and Disaster Preparedness Pacific Risk Exposure Databases and Models Phil Glassey, Paolo Bazzurro, Michael Bonte-Grapentin, Chris Chiesa, Olivier Mahul, EdyBrotoisworo, Phil Bright, David Heron, LiteaBiukoto, Todd Bosse,Steven Clegg, BishwaPandey, Joy Papao, Scott Pontifex, Susan Vocea
Pacific Disaster Risk Assessment • Regional Disaster Impact Database • National and Regional Risk Exposure Databases • Earthquake and Cyclone Hazard Models • Country-specific Catastrophe Risk Models Hazard Assets Exposure Affected Assets Loss $$
Pacific Disaster Risk Assessment • Why? • Data allows risk modelling/profiling • investigate risk financing options (such as Pacific Disaster Reserve Fund) • Guide investment in DRR and CCA • Reduce risk by • avoiding hazardous areas - planning • avoiding vulnerable designs – building permitting and monitoring • Reduce losses by • being prepared • responding quickly and appropriately
Project Coverage • Cook Islands • Fiji • Papua New Guinea (PNG) • Samoa • Solomon Islands • Tonga • Tuvalu • Vanuatu • Fifteen countries considered • Exposure: residential, commercial, industrial, public assets, main infrastructure, major crops, population • Perils: Earthquakes (shaking + tsunami) and Tropical Cyclones (wind, surge, and rain) • Niue • Nauru • Federated States of Micronesia • Marshall Islands • Palau • Kiribati • Timor Leste
Historical Earthquakes 1900-2009 M8.1 4/1/2007 Solomon Islands 54 fatalities 7,000 homeless $3.0MM in aid Federated States of Micronesia Republic of Marshall Islands Palau Kiribati Nauru M8.1 9/29/2009 Samoa and Tonga 192 fatalities 3,000 homeless $3.5MM in aid Tuvalu Solomon Islands Timor Leste Samoa Vanuatu Niue Cook Islands Tonga
Historical Tropical Cyclones 1948-2009 Federated States of Micronesia Republic of Marshall Islands Palau Kiribati Equator Nauru Papua New Guinea Tuvalu Solomon Islands Timor Leste Samoa Fiji Vanuatu Niue Cook Islands Tonga
Number Of Events Major Sources Note: More than 20 sources looked at; some events have data from multiple sources
Building footprint capture • Building footprints captured from VHR satellite imagery • Field checked when doing building field surveys
Summary Building Footprints ~ 340,000 buildings
Summary Asset Survey Largest and most comprehensive dataset for Disaster Risk Management and Climate Change Adaptation ever collected within the Pacific Islands
In-country Surveys The survey involves: • Data preparation and develop mapping projects in advance • Initial consultation with stakeholders • Training of counterpart staff • Field campaigns to collect building and infrastructure data, as well as field check the digitising of building footprints • Determining other available data, negotiating data access and obtaining data. • Determining status of existing Mapserver infrastructure and systems. • A debrief meeting with stakeholders to present the results of the surveys and discuss data use, maintenance and sharing.
Field Data Collection • Collect new information • Utilise pre-prepared menus, hand held devices, satellite imagery and other digital maps and local counterparts
Buildings • Location represented as footprint and point • Attributes captured to characterize building in terms of use and construction • Used to estimate “Fragility” of buildings when exposed to • earthquake shaking • tsunami • cyclonic wind • other hazards
Transportation • Roads and bridges • Airports, Wharves
Utilities • Electricity • Water • Communications
Other data • Topography/Bathymetry • Contours and hydrology • Key for storm surge, tsunami, and cyclonic winds • Geology and soils • Key for earthquake shaking • Census Data • Attributes can be extrapolated using similar building type collected by field work • Used to estimate casualties, human displacement etc
FSM – Yap State Major changes to building stock due to Typhoon Suudal
What else can this data be used for? Damage assessments • Data can be used to assign and calculate damage to buildings already located and characterised in terms of construction • Handheld computers with “damage” menu pages can provide quick and consistent damage reports
Data Collection Issues • Natural hazards: • Cyclone Pat, Aitutaki Cook Islands, • Cyclone Ulia Solomon Islands, • 3 erupting volcanoes in Vanuatu, • Other hazards • Ill health/disease • Dogs – 5 dog bites in all, 3 in Samoa • Inconsistent assistance from local counterparts • Reluctance of Gov’t departments to give access to data • Poor georeferenced imagery/lack of control points • Vehicle difficulties – poor roads • Communication problems • Suspicious people
Challenges - Sustainability • Capacity development within countries to sustain and apply products (‘notanother data collection exercise’) • Data sharing amongst agencies • Development of tools and products to meet country needs • Bridge the gap from Science to Policy – products need to assist development planners and DRM/CCA policy makers