Download
1 / 71
720 likes | 838 Vues
Annual Program Review 2011 Nairobi, Kenya 9 May 2011. A Globally Integrated Africa Soil Information Service ( AfSIS ). Peter Okoth. Grantee institution The International Centre for Tropical Agriculture (CIAT) Budget: US$ 18.1 m Implementing Institution

E N D
Annual Program Review 2011 Nairobi, Kenya9May 2011 A Globally Integrated Africa Soil Information Service (AfSIS) Peter Okoth
Grantee institution • The International Centre for Tropical Agriculture (CIAT) • Budget: US$ 18.1 m • Implementing Institution • Tropical Soil Biology & Fertility (TSBF) Institute of (CIAT) • Partners • Columbia University’s Earth Institute • World Soil Information (ISRIC) • World Agro-forestry Centre (ICRAF) • 5 initial NARS in Africa (Kenya, Tanzania, Malawi, Mali & Nigeria) • 22 other African countries
Presentation Outline • Background • Foreseen Impact • Project Activities • AfSIS Data Systems • Soil Surveys • Fertility trials • Capacity building, user outreach, policy & dissemination
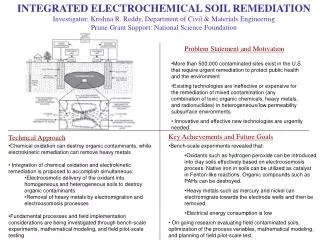
Numbers • About 500 million hectares of sub-Saharan Africa’s agricultural land are moderately or severely degraded • African farmers are able to apply only 10 percent of the nutrients that farmers in the rest of the world return to the soil • Soils in southwestern Kenya, for example, lose an estimated 100 kilograms of nitrogen per hectare each year
Nutrient depleted soils reason for poor crops & low productivity
Large scale land degradation due to soil erosion: How to address?
Foreseen Impact Provide accurate & spatially explicit soil database for 42 African countries Contribute to the reversal of soil degradation in Africa Contribute to increased crop yields & improved livelihoods for approximately 1 to 2 million poor African households Prepare material and evidence to guide policy and action that enhances Africa’s soil & crop productivity Contribute to the development of African institutions capacity in soil mapping & fertility management
Global efforts to raise funds & prepare the globalsoilmap.net Collecting soil pedology legacy data for the African node (AfSIS)Coordinated Dr. Alfred Hartemink-ISRIC Objective 1
Key successes (objectives achieved) • Consortium agreement signed & nodes active • Specifications prepared and agreed upon • Soil legacy data for Africa collected (AfSIS)
Consortium Agreement Signed Slide Credit: Alfred Hartemink
Nodes are Established and Active Eurasia EastAsia North America CUMERC North Africa/West and Central Asia South Asia Latin America/ Caribbean Oceania Africa (South Asia node is still pending)
Objective 2 Cyber Infrastructure & soils database Coordinated by Ms. Sonya Ahmed of New York’s Colombia University- Earth Institute
Electronic mobile data collection toolkits developed Online databases installed on project website Algorithms for digital soil mapping & crop response Repeatable scientific workflows for data processing and analysis Interactive map viewer Tool for submitting soil spectra to and predicting soil properties from spectral libraries Tools for providing location specific, agronomic decision support to research and extension providers
Objective 3 Soil survey covering 18.1 sq km of Sub-Saharan Africa using samples collected from 60 sentinel sites in 27 sub-African countries Coordinated by Dr. Tor Vagen of ICRAF
AfSIS Sentinel Sampling • ~17.5 million km2 of continental SSA • ~0.6 million km2 of Madagascar • Spatially stratified random sampling approach consisting of 60 sites • Each 100 km2 • 42 countries with 95% of human population • ~9,600 new geo-referenced soil profiles • 38,000 individual soil samples
One Sentinel Site 10 km Total of 160 sampling Points per site 10 km 4 soil samples per point
Example of a digital soil carbon condition map of Segou in Mali Low resolution-wider coverage High resolution-less coverage
IR spectroscopy of soils Regional network of NIR spectral laboratories (in the NARS) MPA (NIR) spectrometer in Bamako Construction of IR lab in Lilongwe MPA (NIR) spectrometer in Arusha NIR training, Arusha Field testing of new spectrometer Tor-G. Vågen, Lulseged T. Desta, Leigh Winowiecki, Jerome E. Tondoh and Keith D. Shepherd
Reference soil analyses (Nairobi) Tor-G. Vågen, Lulseged T. Desta, Leigh Winowiecki, Jerome E. Tondoh and Keith D. Shepherd
Some highlights of AfSISactivities in Southern Africa Built infrastructure and employed staff Employed field and laboratory staff – provided training ...
Field Sample Collection (started Feb. 2010) Infiltration measurement Trip to Inhassunge sentinel site in Mozambique • So far, Nine sites have been surveyed: • 2 in Malawi • 6 in Mozambique • 1 in Zambia (2 will be completed soon) Training partners on data collection
Sample Preparation and Processing Near-infrared spectroscope for soil sample scanning Soil sample preparation in the lab at Chitedze Research Station in Lilongwe So far, 2500 soil samples have been scanned
Database Management System and Analyses Automated scientific workflow for data analysis
Automated reporting on soil properties Soil chemical and physical reference values Tor-G. Vågen, Lulseged T. Desta, Leigh Winowiecki, Jerome E. Tondoh and Keith D. Shepherd
Documentation of AfSIS methods and guidelines for implementation Tor-G. Vågen, Lulseged T. Desta, Leigh Winowiecki, Jerome E. Tondoh and Keith D. Shepherd
Objective 4 Implementing soil fertility diagnostic trials Formulating decision support systems Formulating management recommendation Coordinated by Dr. Jeroen Huising of CIAT-TSBF
Goal: Reducing Yield Gap Potential yield Actual yield
Maize Cultivation in Nyanza 5 to 8 plants per hole Continuous with no inputs-poor spacing Better planting with no fertilizers
Maize planted same day on adjacent fields on 13th April 2009 With DAP & Beans Without DAP
Selected Sites Kontela Pampaida Sidindi Koloko Ibi Kiberashi Mbinga Nkhata Bay Thuchila
Effect of fertilizer and amendments Thuchila, Malawi - Maize Koloko, Mali - Sorghum Sidindi, Kenya- Maize Kontela, Mali - Sorghum Nkhata Bay, Malawi - Maize Kiberashi, Tanzania - Maize Error bars are bootstrap confidence limits
Co-locating trials with Obj. 3 sampling sites • Total of 32 fields per sentinel site • Two (2) diagnostic trials per cluster randomly selected • Field centered to Y-frame • Partial replication AfSIS Annual Planning Meeting 2010
Linking objectives 3 and 4 synergies / opportunities Tor-G. Vågen, Lulseged T. Desta, Leigh Winowiecki, Jerome E. Tondoh and Keith D. Shepherd
Linking sentinel site baselines and diagnostic trials Co-locating trials at cluster level Relating maps to crop performance Kiberashi Sentinel Site, Tanzania Tor-G. Vågen, Lulseged T. Desta, Leigh Winowiecki, Jerome E. Tondoh and Keith D. Shepherd
Linking sentinel site baselines and diagnostic trials Crop growth performance in eroded (TRUE) vs non-eroded (FALSE) areas Control NPK+Manure Kiberashi Sentinel Site, Tanzania Gompertz function: Tor-G. Vågen, Lulseged T. Desta, Leigh Winowiecki, Jerome E. Tondoh and Keith D. Shepherd
Moist Savanna and Woodland Zones Area: 4.4 million km2 Population: 157 million Maize belt: 32 million ha CA potential: 7 million ha Humid Forest Zone Area: 5.8 million km2 Population: 168 million Cassava belt: 18 million ha NERICA potential: 2 million ha N E W S 0 1000 2000 kilometers Initial Impact zones targeted by AfSIS The SahelianDrylands Area: 1.2 million km2 Population: 38 million Millet & sorghum belt: 23 million ha Mali Nigeria Kenya Tanzania Malawi
Objective 5 Serving end users, Packaging AfSIS Products, policy, & impact pathways Coordinated by Dr. Peter Okoth CIAT-TSBF
Specific Activities Coordinating the national partners & stakeholders Capacity building (Human & infrastructure) Serving end users Communication Policy Advocacy Gender