Chapter 3 Chronic Obstructive Pulmonary Disease
380 likes | 975 Vues
Chapter 3 Chronic Obstructive Pulmonary Disease. Topics. Emphysema Chronic Bronchitis Pressure-volume curve Dynamic airway compression Ventilation-perfusion inequality. Case Study #3: Chuck. Used car salesman SOB over the last 3 years Chronic cough for 15 yrs Yellow, purulent sputum

Chapter 3 Chronic Obstructive Pulmonary Disease
E N D
Presentation Transcript
Topics • Emphysema • Chronic Bronchitis • Pressure-volume curve • Dynamic airway compression • Ventilation-perfusion inequality
Case Study #3: Chuck • Used car salesman • SOB over the last 3 years • Chronic cough for 15 yrs • Yellow, purulent sputum • 45 yr smoking history • 2 packs a day • Intermittent swelling of the ankles • Respiratory infection history • No family history of lung disease
Case Study #3: Chuck • Dyspneic • Florid appearance • Cyanotic • BP: 150/80 • Barrel shaped chest • Ankle edema • Whistling lung sounds
Chuck • Hb: 17 g/dl • X-ray • Showed over inflation • Ppa: 30 mmHg • Vo2 max: 1.2 L/min • Treatment • Bed rest, oxygen therapy, bronchodilators, diuretics • Advised to stop smoking • COPD rehab program
Chuck • 6 mo later • Admitted with acute chest infection • Marked dyspnea • Purulent sputum • Cyanosis • Rales • Obvious ankle edema • PaO2: 42 mmHg • PaCO2: 55 mmHg • pH 7.30 • died
Chronic Bronchitis • Autopsy • Lungs voluminous and lacked elastic recoil, some bronchi filled with mucus secretions, much destruction, with alveolar destruction prominent • Definite Chronic Bronchitis (blue bloaters) and emphysema (pink puffers), which caused respiratory failure
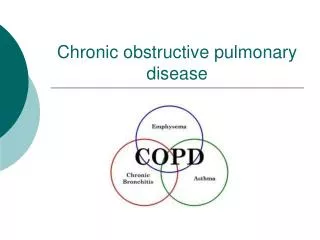
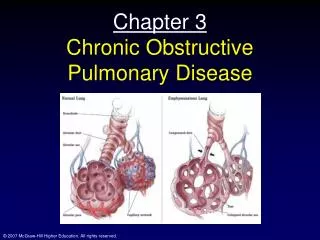
Pathology • Structure • Alveolar destruction • Enlarged airspaces • Emphysema: • From the latin to inflate • Characterized by enlargement of the air spaces distal to the terminal bronchioles w/ destruction of the alveolar walls
COPD and lung function • Chronic bronchitis • Marked by hypertrophied mucus glands • Inflammatory response due to irritants in smoke • Airways are swollen and blocked by mucus • Increased sputum production
Physiology & pathophysiology • Increasing SOB • Thickened bronchial walls • Obstruction • Poorly supported airways • Airway collapse • Florid with central cyanosis • Elevated Hb • Low SaO2 • Low Po2 • Release of EPO
Physiology & pathophysiology • Overinflation: inc. lung volume • Whistling sounds caused by increased turbulence • Neck vein engorgement, ankle edema and enlarged liver consistent with pulm hypertension • Right axis deviation is consistent with hypertrophy of the RV
Pressure volume curve • Gives you the compliance curve • Gives information about the elasticity of the lung • Pleural pressure is the negative pressure created by the outward pull of the ribcage and the inward pull of the lung • The lung will inflate as this pressure becomes more negative • Hysteresis • Transpulmonary pressure: pressure differential across the lung • Diff betw intrapulmonary and intrapleural pressures
Compliance • Volume change per unit pressure change (ΔV/ΔP) • Lung very compliant in the middle of the curve; very stiff on the ends • Emphysema Increases the compliance and reduces the elasticity of the lung
Regional differences in Ventilation • Uneven • Higher in lower lung units, lowest in upper • Posture dependent • Laying supine • Highest in posterior lung
Regional differences in Ventilation • At low lung volumesNow intrapleural pressures are uniformly less negative (lung is smaller); base is now being compressed and ventilation is impossible; so apex is now better ventilated; typically apex is better ventilated • Why? • Intrapleural pressure less negative at base • Due to the weight of the lung • Upper lobes are already somewhat distended • Lower lobes thus fill more (larger unit change in volume)
Airway closure • Compressred regions do not have all the air squeezed out • Small airways close first • Traps gas • Usu. Occurs only at low lung volumes • In aging the volume this occurs at rises; why? • Dependent regions of the lung are poorly ventilated
Forced expiration • Measured with spirometer • FEV1.0 • FVC • Measured after breath to TLC • FEF25-75% Measure of elasticity of lung
Dynamic compression of Airways • Descending limb is invariant because it is “effort independent” • What limits flow? • Only at high volumes does increased effort result in increased flow
Dynamic airway compression • Airways are compressed as intrathoracic pressure increases • A: opening pressure of 5 cmH2O • B: Opening pressure of 6 cmH2O • C: Opening pressure of 8 • D: Closing pressure of 11 cmH2O • Thus, maximal flow decreases with lung volume • Lung volume changes here are entirely due to elastic recoil • Worse in emphysematous lungs as elastic recoil is reduced
Blood gases • PaO2 declines somewhat with age • Cause: • VA/Q mismatch • Po2 is determined by the ratio of ventilation to blood flow
Ventilation-perfusion inequality • A: normal VA/Q • B: No ventilation; so VA/Q of 0 • C: No blood flow: VA/Q of ∞ • Note how VA/Q is different betw apex and base of lung
Ventilation-perfusion • Areas with very high VA/Q add very little to oxygen to blood; thus PaO2 is dominated by areas of low VA/Q • Also shape of O2-Hb dissociation curve dictates that areas of very high VA/Q cannot increase the oxygenation of the blood very much, while areas of low VA/Q can lower Po2 considerably
Ventilation-perfusion • Normal lung, A-aDO2 is about 4 mmHg due to VA/Q mismatching • Disease can increase this by quite a bit • MIGET • Inert gases with range of solubilities infused intravenously • Measure concentrations in arterial blood and expired air • No blood flow to unventilated areas (no shunt)
Measurement of ventilation-perfusion inequality • Alveolar-arterial Po2 difference • PAO2 = PIO2 – [PACO2/R] • Chuck: • 149-[49/0.8] = 88 mmHg • PaO2 = 58 • AaDO2= 30 • PaCO2 • Chuck: 49 mmHg • VA/Q mismatch • Hypoventilation: Pco2 = [Vco2/VA]*K • pH: falls due to elevated Pco2 (respiratory acidosis)
Acclimatization and High-altitude diseases • Hyperventilation • Hypoxemia stimulates peripheral chemoreceptors; blows off Co2, raises PAO2 • PB 250 mmHg do calculation • Renal compensation reduces HCO3- • Polycythemia • Increased Hct and [Hb] • Increases O2 carrying capacity: draw eq. • EPO form kidney • Other features • Rightward shift in O2-Hb dissociation curve (Leftward at extreme altitude) • Improves off-loading of O2 at the tissues • Caused by ↑2,3 DPG at altitude • Increased capillary-to-fiber volume ratio • Muscle mass drops at altitude
Acclimatization and High-altitude diseases • Acute mountain sickness • Headache, dizziness, palpitations, insomnia, loss of appetite and nausea • Hypoxemia and resp. alkalosis • Chronic mountain sickness • Cyanosis, fatigue, severe hypoxemia, marked polycythemia • High altitude pulmonary edema • Severe dyspnea, orthopnea, cough, cyanosis, crackles and pink, frothy sputum • Life threatening • Associated with elevated Ppa (hypoxic pulm vasoconstriction) • High altitude cerebral edema • Confusion, ataxia, irrationality, hallucinations, loss of consciousness and death • Fluid leakage into brain